Observed vs expected
A chi-square test may be needed.
AP Biology · Unit 5 Learning Journey
A chi-square test is a statistical tool that compares observed genetic data with expected inheritance predictions. In AP Biology Unit 5, chi-square is often used to test whether offspring counts fit a predicted Mendelian or non-Mendelian ratio. The key skill is not just calculating a number; it is using evidence to decide whether differences are likely due to chance.
The previous guide, Non-Mendelian Genetics, explained how inheritance patterns can change expected ratios. This page explains how to compare those expected ratios with actual observed data. After this page, use Unit 5 Practice Questions to combine meiosis, inheritance, Punnett squares, and data analysis.
A chi-square test compares observed results from an experiment with expected results predicted by a genetic model. In heredity problems, expected counts often come from Punnett square ratios such as 3:1, 1:1, or 9:3:3:1. AP Biology uses chi-square to decide whether differences between observed and expected counts are likely due to chance.
Chi-square tests whether genetic data fit an expected ratio.
Expected data come from a genetic prediction, usually a Punnett square ratio. For example, a 3:1 ratio predicts three dominant phenotype offspring for every one recessive phenotype offspring.
Observed data are the actual counts collected from an experiment. These counts rarely match expected values perfectly.
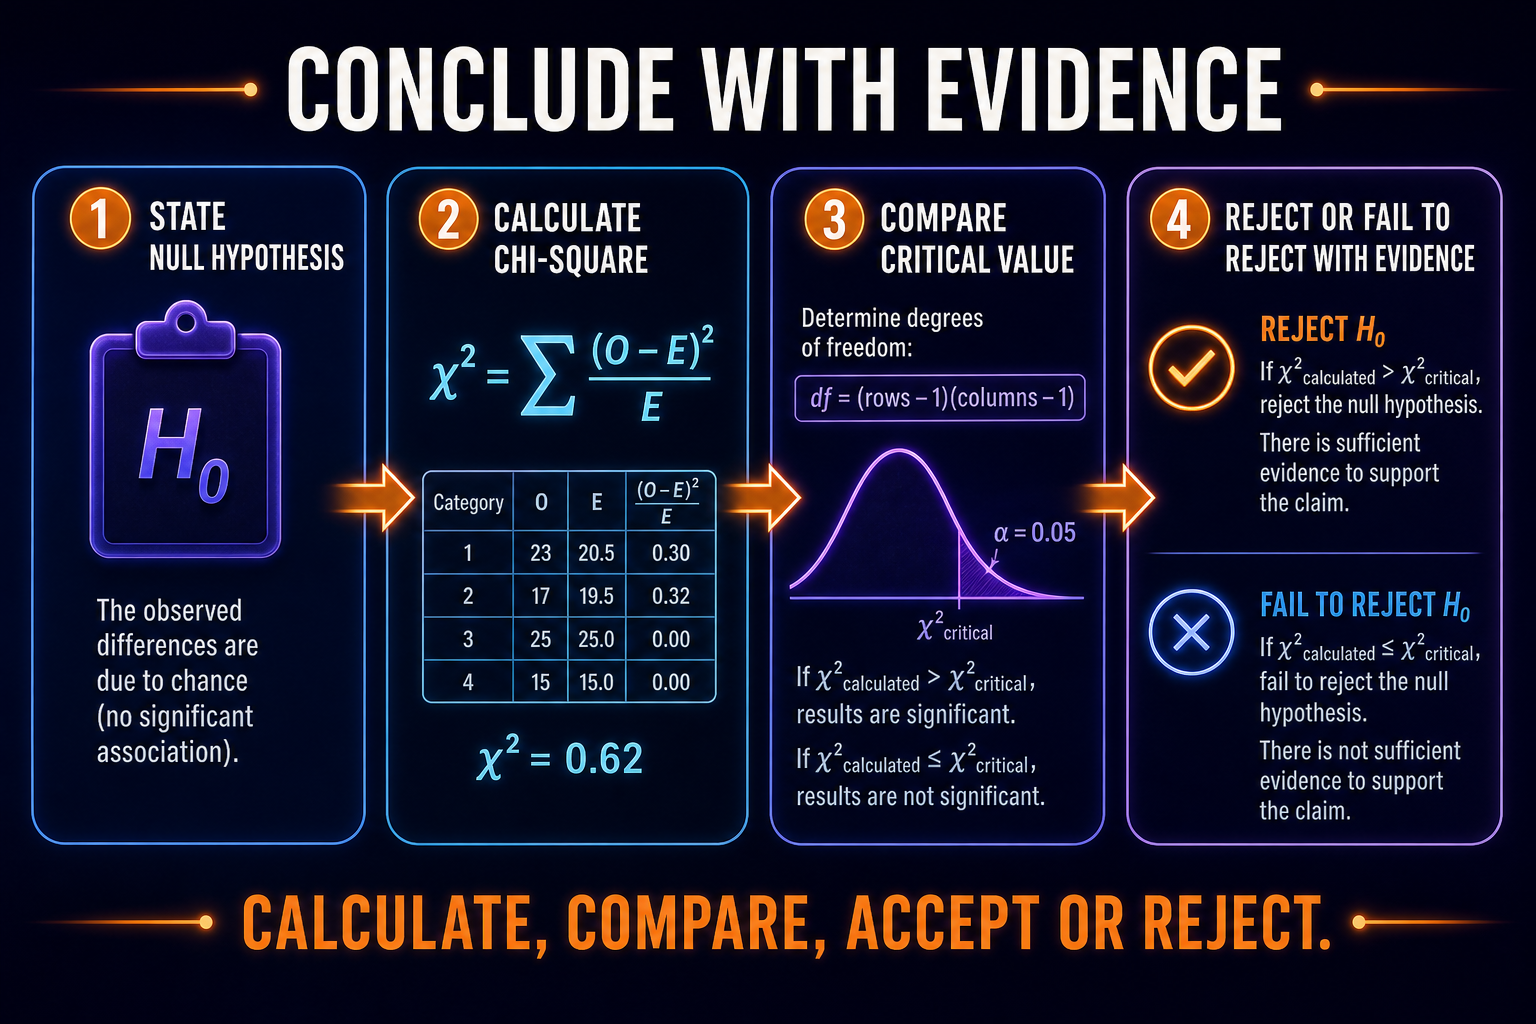
The null hypothesis usually says the observed results are not significantly different from expected results. In simple terms, any difference is due to chance.
The chi-square value measures how far observed counts are from expected counts. Larger values mean a bigger difference between data and prediction.
The conclusion compares the chi-square value to a critical value. The answer should say whether the null hypothesis is rejected or not rejected.
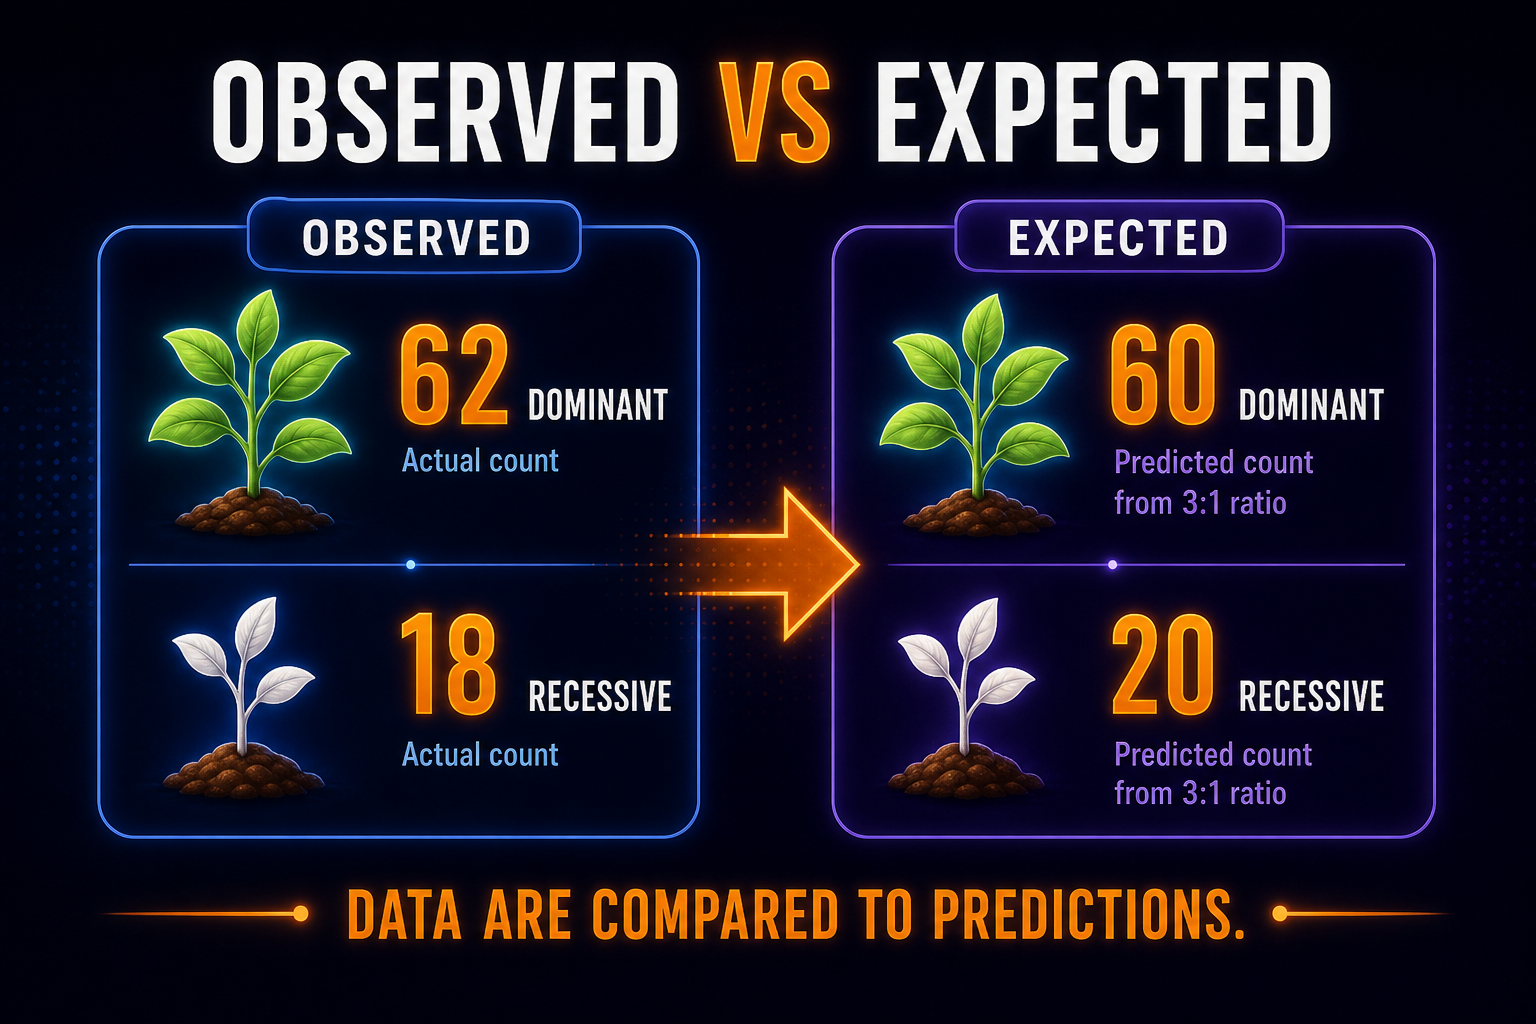
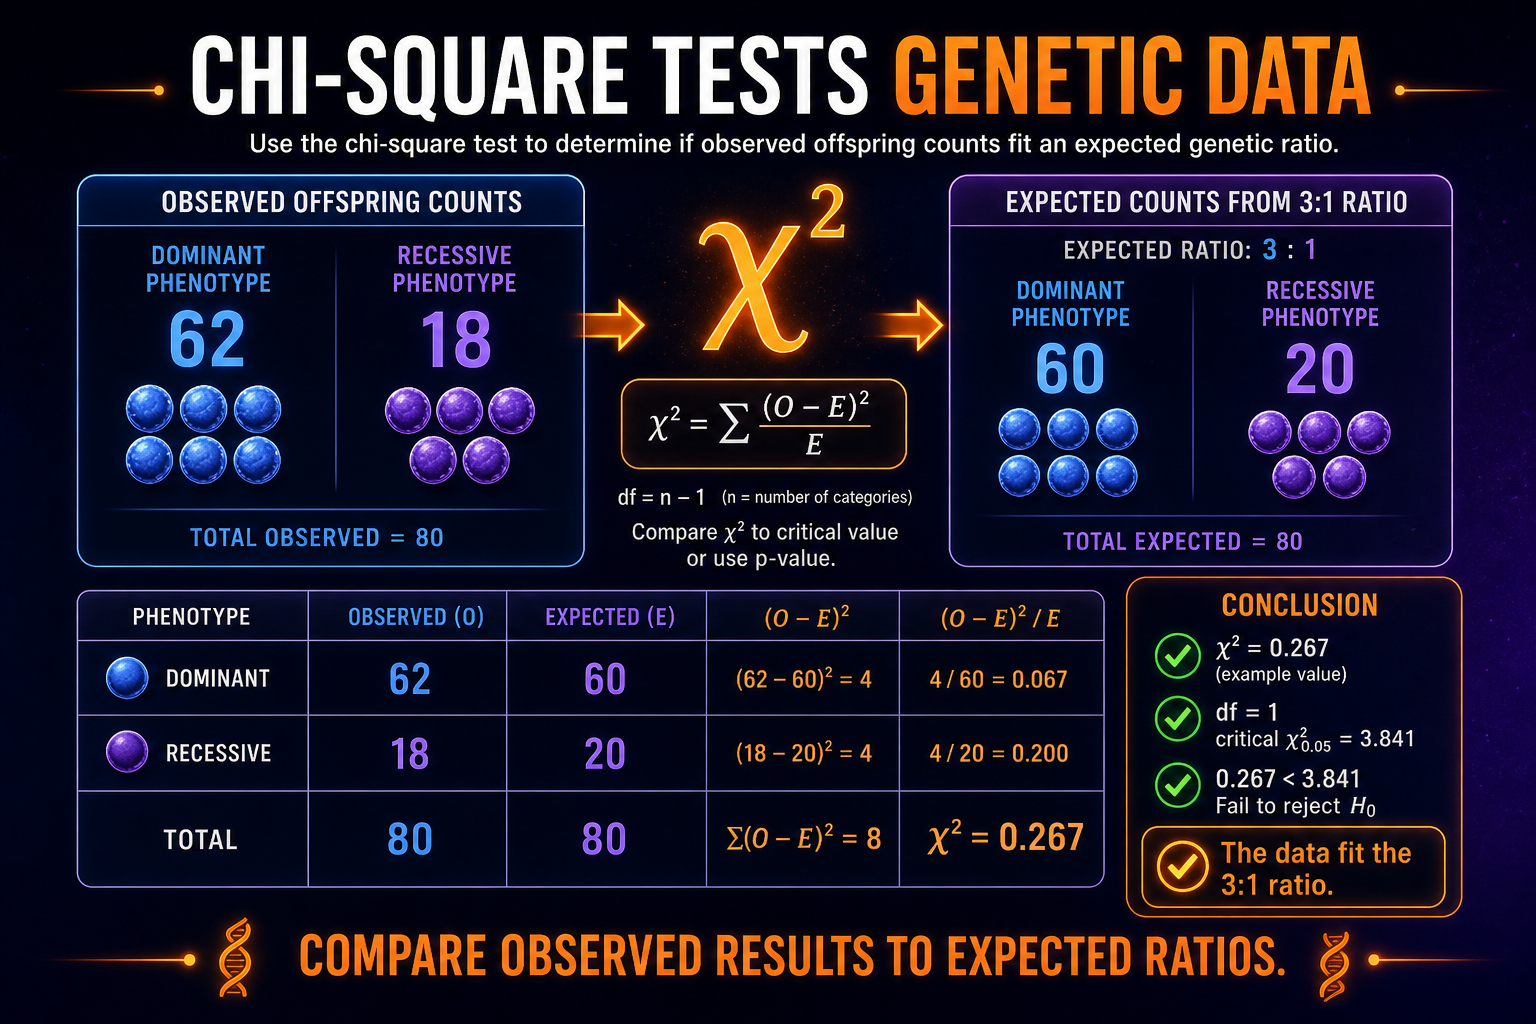
Observed counts are the actual results from a cross or experiment. Expected counts are calculated from the predicted inheritance ratio. For example, if a 3:1 phenotype ratio is expected from 80 offspring, the expected counts are 60 dominant and 20 recessive.
Direct answer: Observed means actual data. Expected means predicted data from the inheritance model.
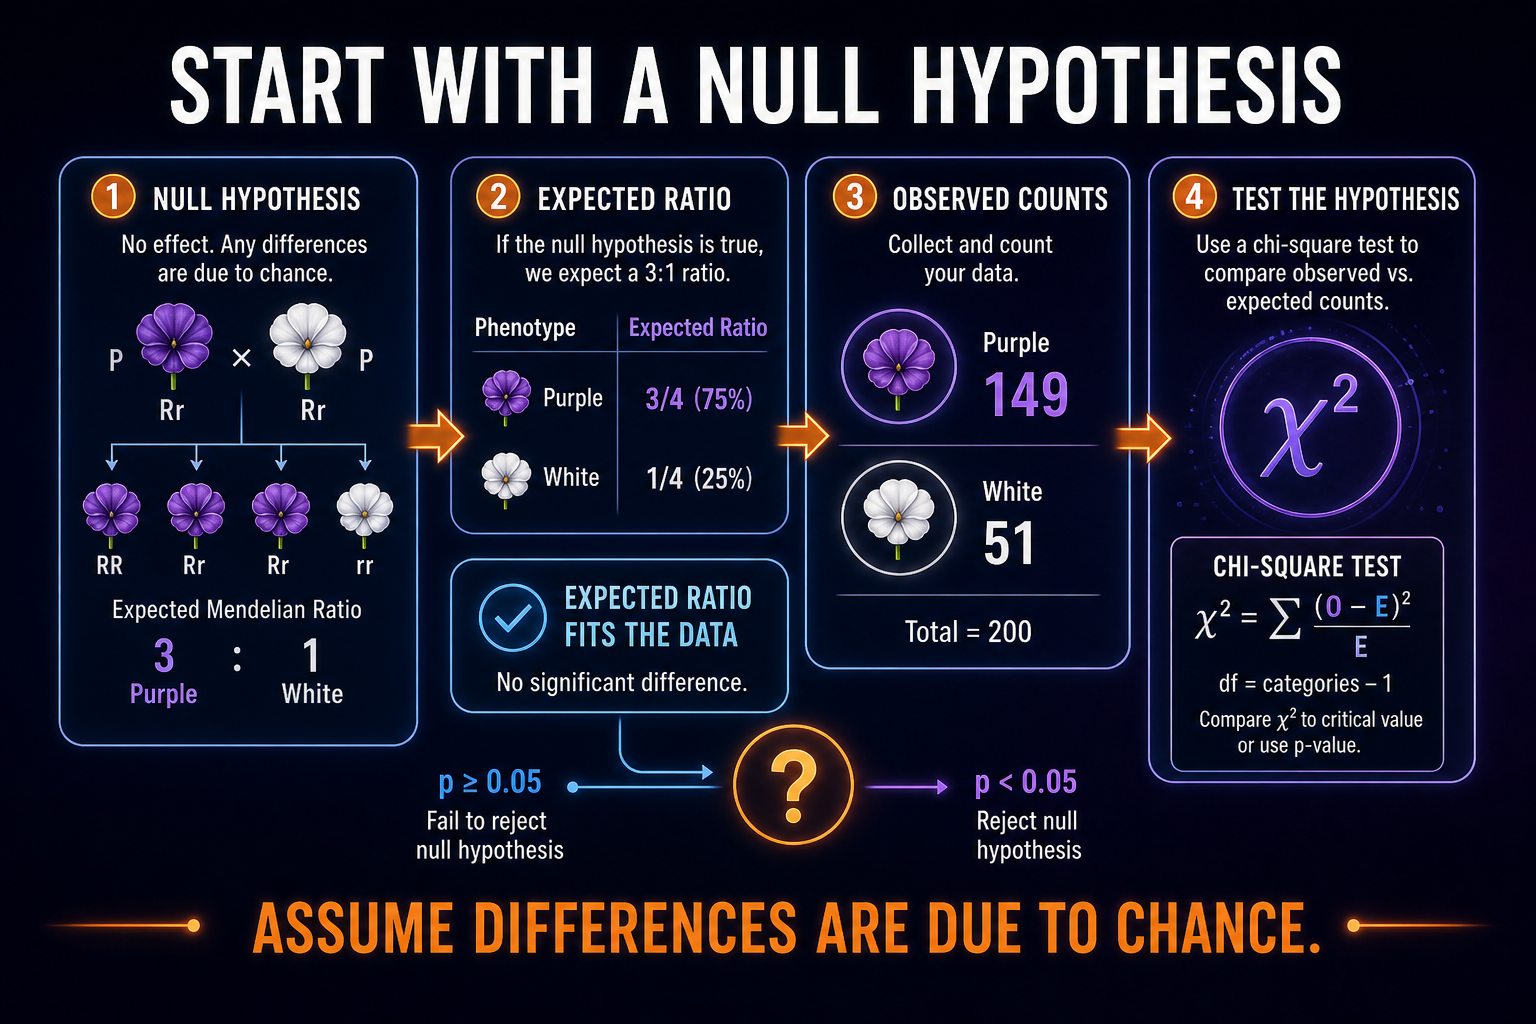
In AP Biology genetics, the null hypothesis usually states that the observed data fit the expected inheritance ratio. In other words, any difference between observed and expected counts is likely due to chance. A chi-square test helps decide whether the difference is large enough to reject that hypothesis.
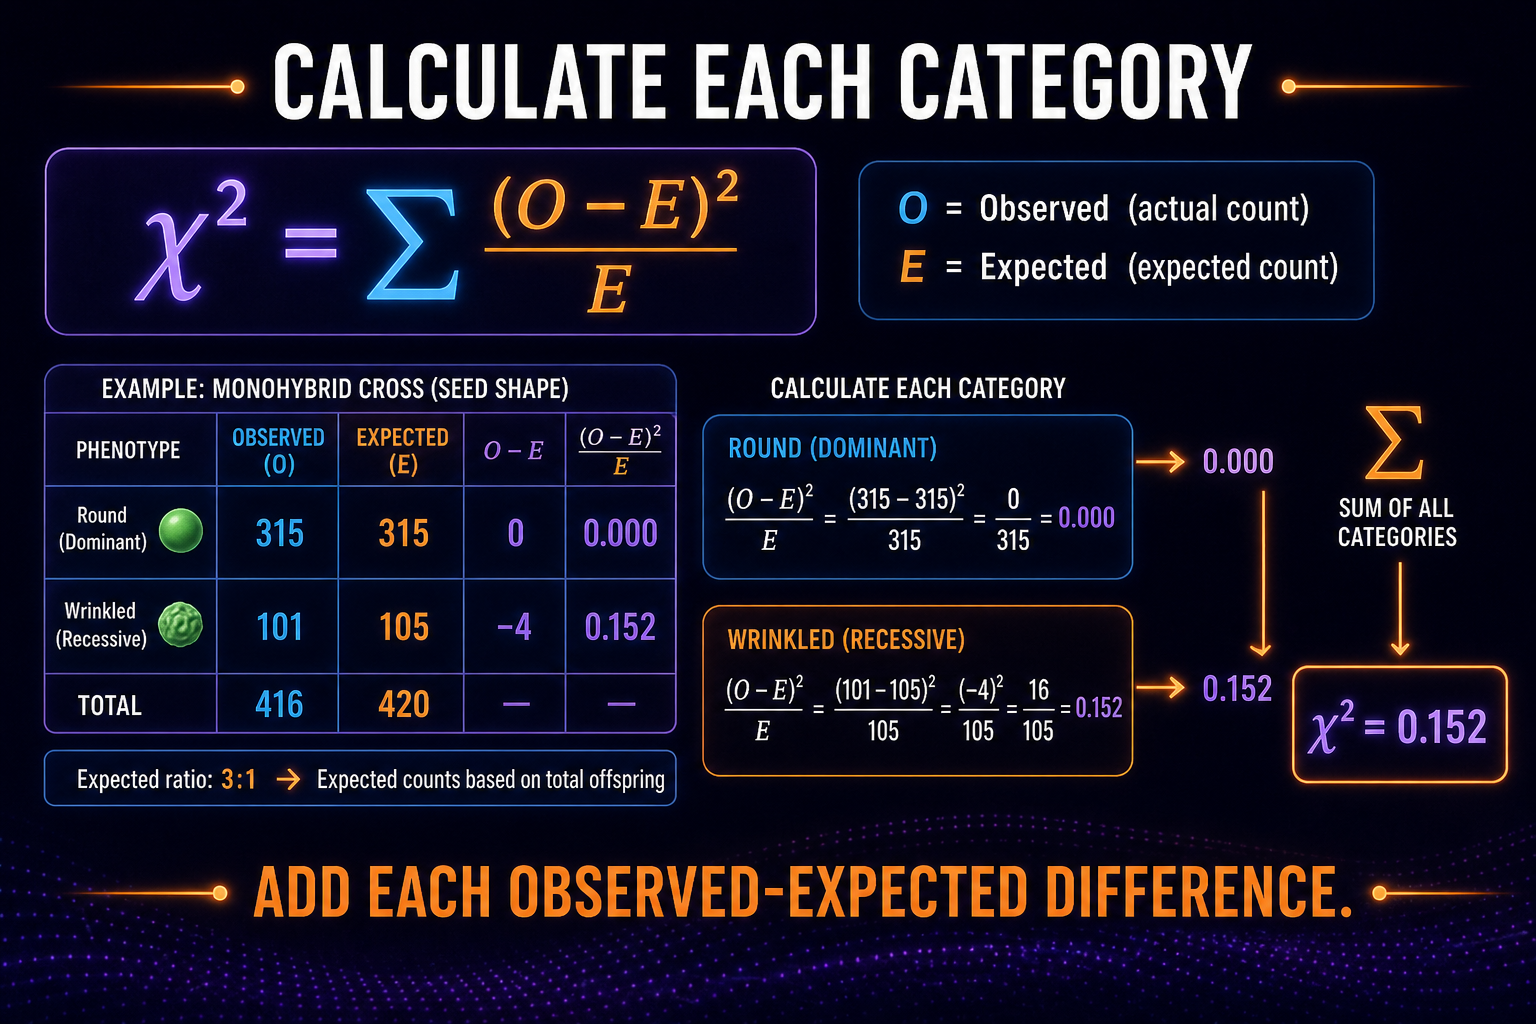
χ² = Σ ((observed − expected)² / expected)
For each phenotype category, subtract expected from observed, square the difference, divide by expected, and then add all category values. Squaring prevents positive and negative differences from canceling out. AP Biology often gives the formula, but students still need to organize observed and expected counts correctly.
| Category | Observed | Expected | (O − E)² / E |
|---|---|---|---|
| Dominant phenotype | 62 | 60 | 0.067 |
| Recessive phenotype | 18 | 20 | 0.200 |
| Total χ² | — | — | 0.267 |
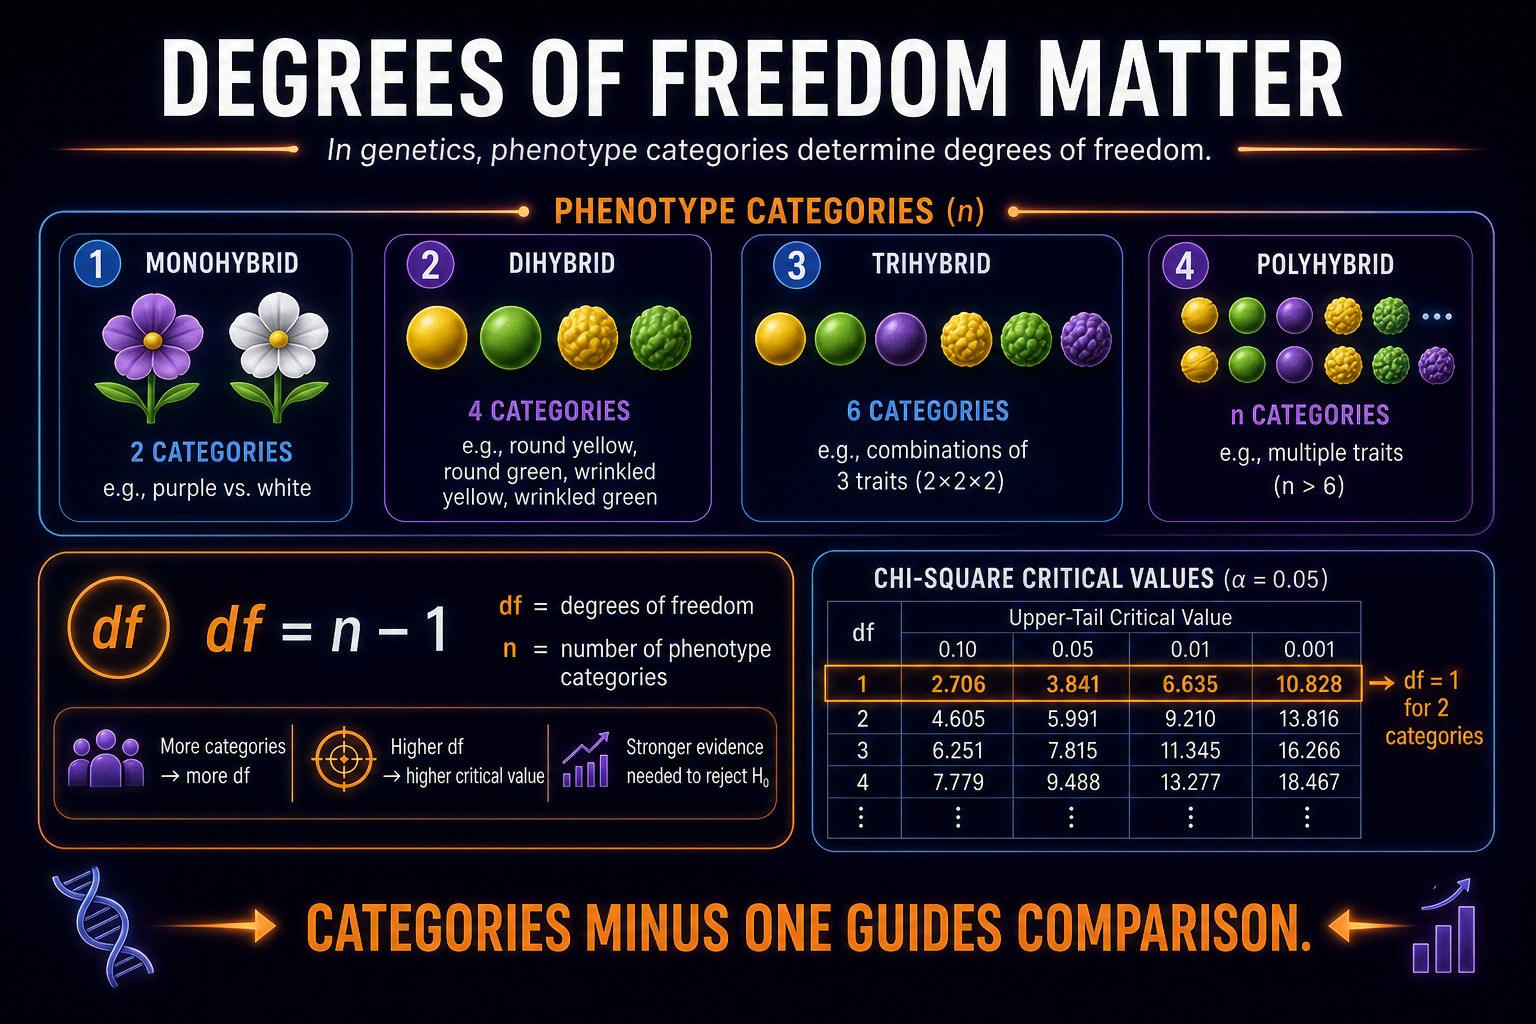
Degrees of freedom tell you which row to use on a chi-square critical value table. For most AP Biology genetics problems, degrees of freedom equal the number of phenotype categories minus one. If there are two phenotype categories, degrees of freedom equals one.
Direct answer: Degrees of freedom = number of categories − 1.
After calculating chi-square, compare it to the critical value for the correct degrees of freedom and significance level. AP Biology commonly uses p = 0.05. If the chi-square value is greater than the critical value, reject the null hypothesis; if it is less than or equal to the critical value, fail to reject the null hypothesis.
| Result | Interpretation | AP wording |
|---|---|---|
| χ² ≤ critical value | Difference is not statistically significant | Fail to reject the null |
| χ² > critical value | Difference is statistically significant | Reject the null |
| p > 0.05 | Difference likely due to chance | Data fit expected ratio |
| p < 0.05 | Difference unlikely due to chance | Data may not fit expected ratio |
A strong AP Biology conclusion names the statistical decision and connects it to the genetic model. Do not simply write the chi-square number. Explain whether the observed data support the expected inheritance ratio.
Because the calculated χ² value is ___ than the critical value of ___, the null hypothesis is ___. The observed data ___ the expected ___ ratio because ___.
A chi-square test may be needed.
Use the ratio to calculate expected counts.
Assume observed differences are due to chance.
Use categories minus one.
Compare the calculated chi-square value.
Observed data differ significantly from expected data.
Assume observed differences from expected counts are due to chance.
Use the genetic ratio from the cross or Punnett square prediction.
Find the chi-square value and compare it to the critical value for the correct df.
State reject or fail to reject and connect to the inheritance model.
The null hypothesis is that ___. The calculated χ² value is ___. Because this value is ___ than the critical value, the null hypothesis is ___. Therefore, the data ___ the expected ratio.
Fix: Chi-square uses observed and expected counts, not percentages.
Fix: Expected values come from the predicted genetic ratio.
Fix: Degrees of freedom equal categories minus one.
Fix: You reject or fail to reject the null hypothesis.
Fix: If p is below 0.05, the difference is statistically significant.
Fix: Always explain what the chi-square result means for the genetic model.
Revealed: 0 of 4 scenarios
A cross is expected to produce a 3:1 phenotype ratio, but observed counts are 62 and 18.
Answer: Use chi-square to compare observed counts with expected counts from the 3:1 ratio.
There are four phenotype categories in a genetics problem.
Answer: Degrees of freedom are 3 because df = categories - 1.
The calculated chi-square value is greater than the critical value.
Answer: Reject the null hypothesis because the difference is statistically significant.
A student says the data prove the expected ratio is correct.
Answer: Fix the wording: chi-square can support failing to reject the null, but it does not prove the model is true.
Answer all eight questions. Choices shuffle on reload—focus on mechanism, not letter memorization.
More drills: Unit 5 practice questions, practice by topic, or daily AP Biology practice.
Open each card, draft your response, then reveal the rubric and sample. For more free-response practice, open the Unit 5 FRQ guide.
A plant cross is expected to produce a 3:1 phenotype ratio. The observed results are 62 dominant phenotype offspring and 18 recessive phenotype offspring.
Expected counts from a 3:1 ratio out of 80 offspring are 60 dominant and 20 recessive. The calculated χ² value is approximately 0.267. This value would be compared to the critical value at df = 1 and p = 0.05. If χ² is less than or equal to the critical value, fail to reject the null hypothesis and conclude the data support the expected 3:1 ratio.
Status: Draft your answer first—then open the rubric or sample.
A dihybrid cross is expected to produce four phenotype categories in a 9:3:3:1 ratio. A student collects observed counts and uses a chi-square test.
Degrees of freedom are 3 because df = number of categories − 1 and there are four phenotype categories. Expected counts are needed so each observed category can be compared to the predicted 9:3:3:1 ratio. If the calculated χ² is greater than the critical value, reject the null hypothesis because the difference between observed and expected counts is statistically significant and unlikely due to chance alone.
Status: Draft your answer first—then open the rubric or sample.
A chi-square test compares observed data with expected data. In AP Biology genetics, expected data usually come from an inheritance ratio predicted by a Punnett square. The test helps decide whether differences are likely due to chance.
Chi-square is used because real offspring counts often do not match expected ratios exactly. The test helps determine whether the difference is small enough to be explained by chance. AP Biology often uses it to evaluate inheritance models.
Observed values are the actual counts collected from an experiment or cross. For example, the number of offspring with each phenotype is observed data. These counts are compared with expected values in the chi-square calculation.
Expected values are predicted counts based on a genetic ratio. For example, a 3:1 ratio out of 80 offspring predicts 60 dominant phenotype and 20 recessive phenotype. Expected values must be counts, not just percentages.
The null hypothesis usually states that observed results are not significantly different from expected results. In genetics, that means the data fit the expected inheritance ratio. Differences are assumed to be due to chance unless the test shows otherwise.
For most AP Biology chi-square genetics problems, degrees of freedom equal the number of phenotype categories minus one. If there are two categories, df = 1. If there are four categories, df = 3.
Compare the calculated chi-square value with the critical value for the correct degrees of freedom. If the calculated value is greater than the critical value, reject the null hypothesis. If it is less than or equal to the critical value, fail to reject the null hypothesis.
Rejecting the null means the observed data are significantly different from the expected data. The difference is unlikely to be due to chance at the chosen significance level. In genetics, this may mean the expected inheritance model does not fit well.
Failing to reject the null means the observed data are not significantly different from the expected data. The difference can reasonably be explained by chance. It does not prove the model is true; it only means the data do not strongly contradict it.
Show the expected counts, calculate or explain the chi-square value, and compare it with a critical value. Then state whether the null hypothesis is rejected or not rejected. Finish by connecting the decision to the genetic ratio or inheritance model.