Parent genotypes
Use them to list gametes.
AP Biology · Unit 5 Learning Journey
Punnett squares are probability models that show possible allele combinations in offspring. They use parent genotypes and gametes to predict genotype and phenotype ratios. In AP Biology Unit 5, the key skill is explaining the inheritance logic behind the square, not just filling in boxes.
The previous guide, Mendelian Genetics, explained alleles, dominance, genotype, phenotype, and segregation. Punnett squares turn those inheritance rules into probability predictions. After this page, study Non-Mendelian Genetics to see when simple dominant-recessive Punnett square logic needs to be adjusted.
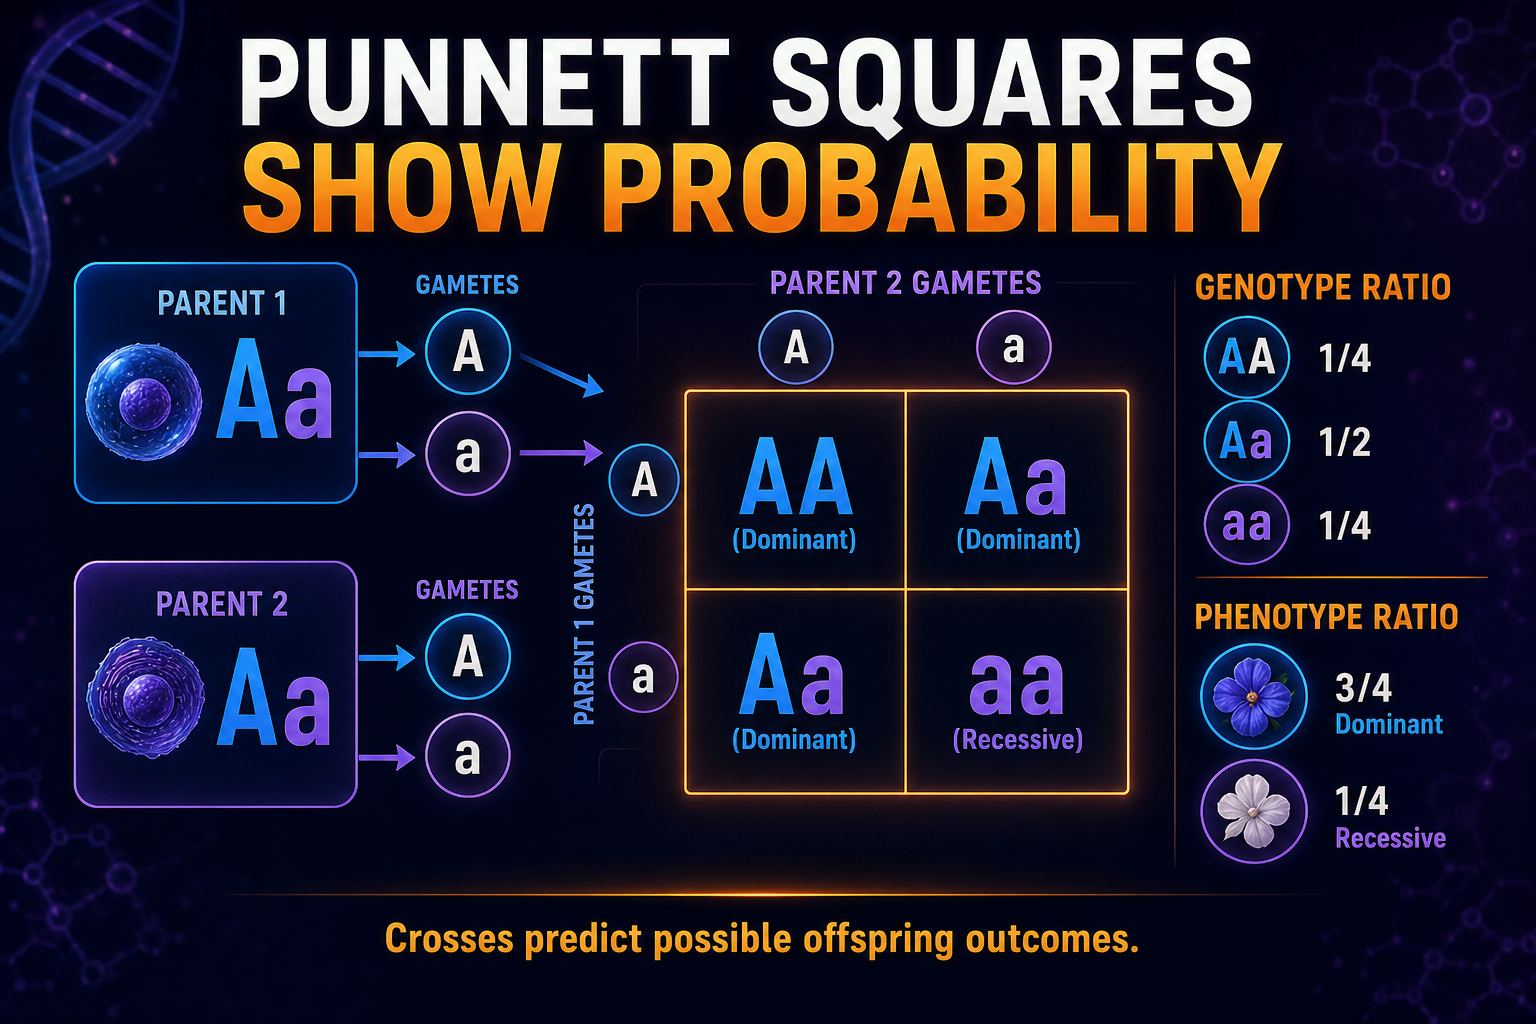
A Punnett square is a genetics probability model that predicts possible allele combinations in offspring. It uses parent genotypes to list possible gametes, then combines those gametes to show possible offspring genotypes. AP Biology uses Punnett squares to connect meiosis, segregation, inheritance patterns, genotype ratios, and phenotype ratios.
Punnett squares predict possible offspring genotypes and phenotypes.
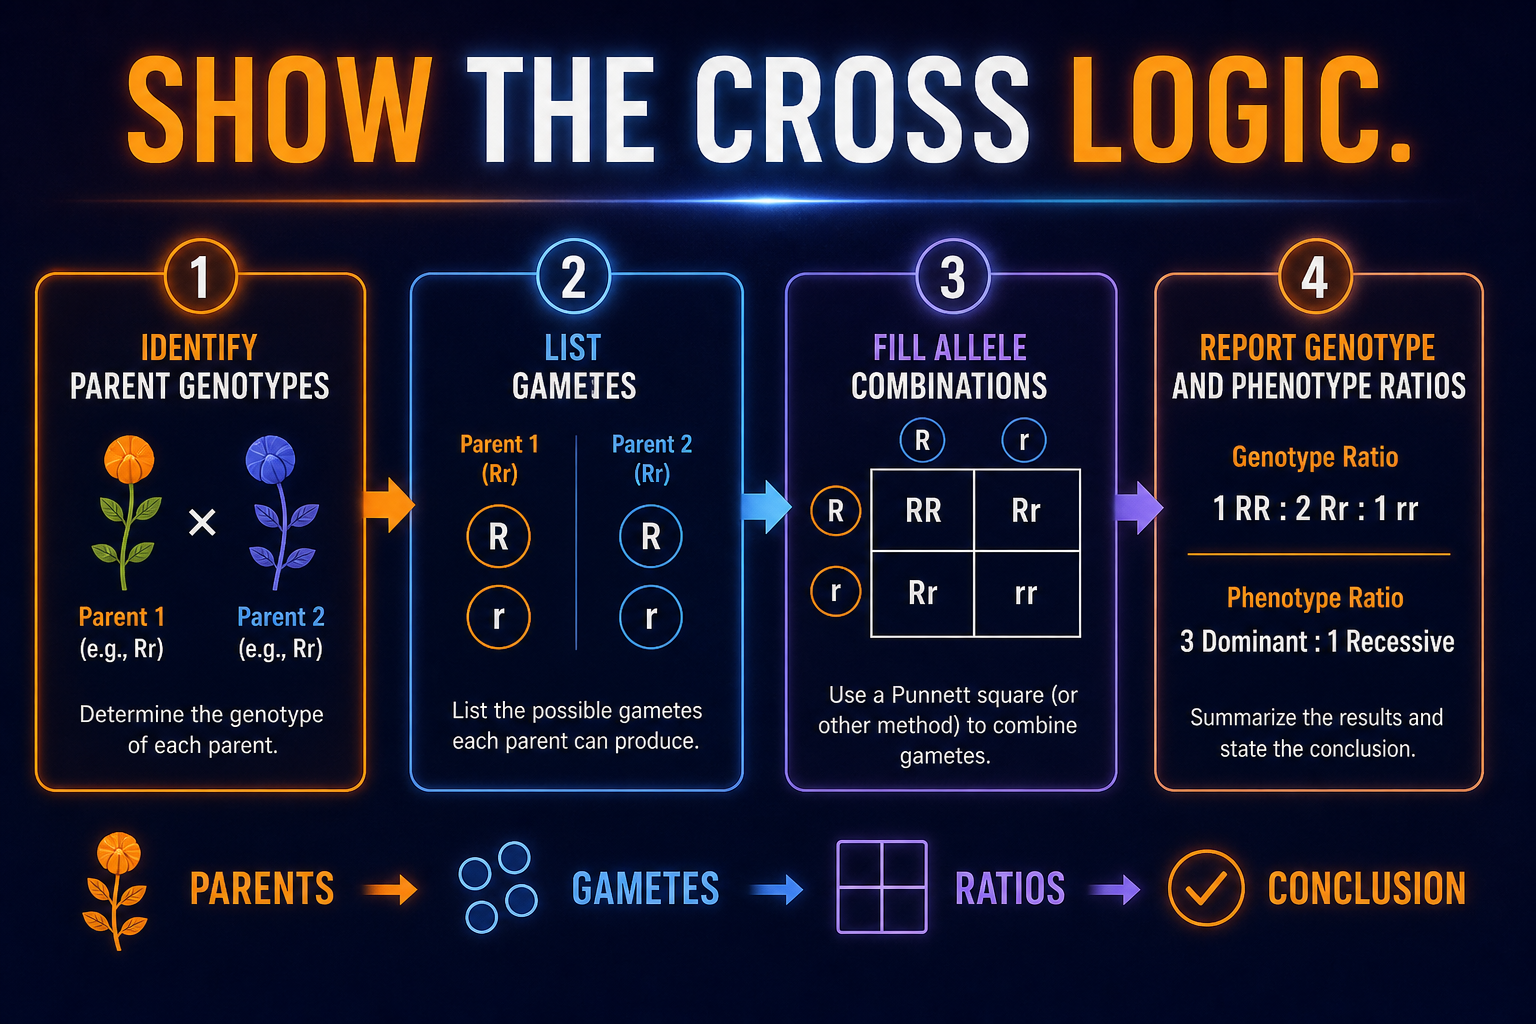
Start with the parent genotypes. Without parent genotypes, the square has no reliable starting point.
Each gamete carries one allele for the gene being tracked. Gametes come from allele segregation during meiosis.
Each box combines one gamete from each parent. The boxes show possible offspring genotypes.
After the square is filled, count genotypes and translate them into phenotype ratios. AP Biology may ask for either one.
Punnett squares show probability, not certainty. A 3:1 ratio is an expected pattern, not a guarantee for exactly four offspring.
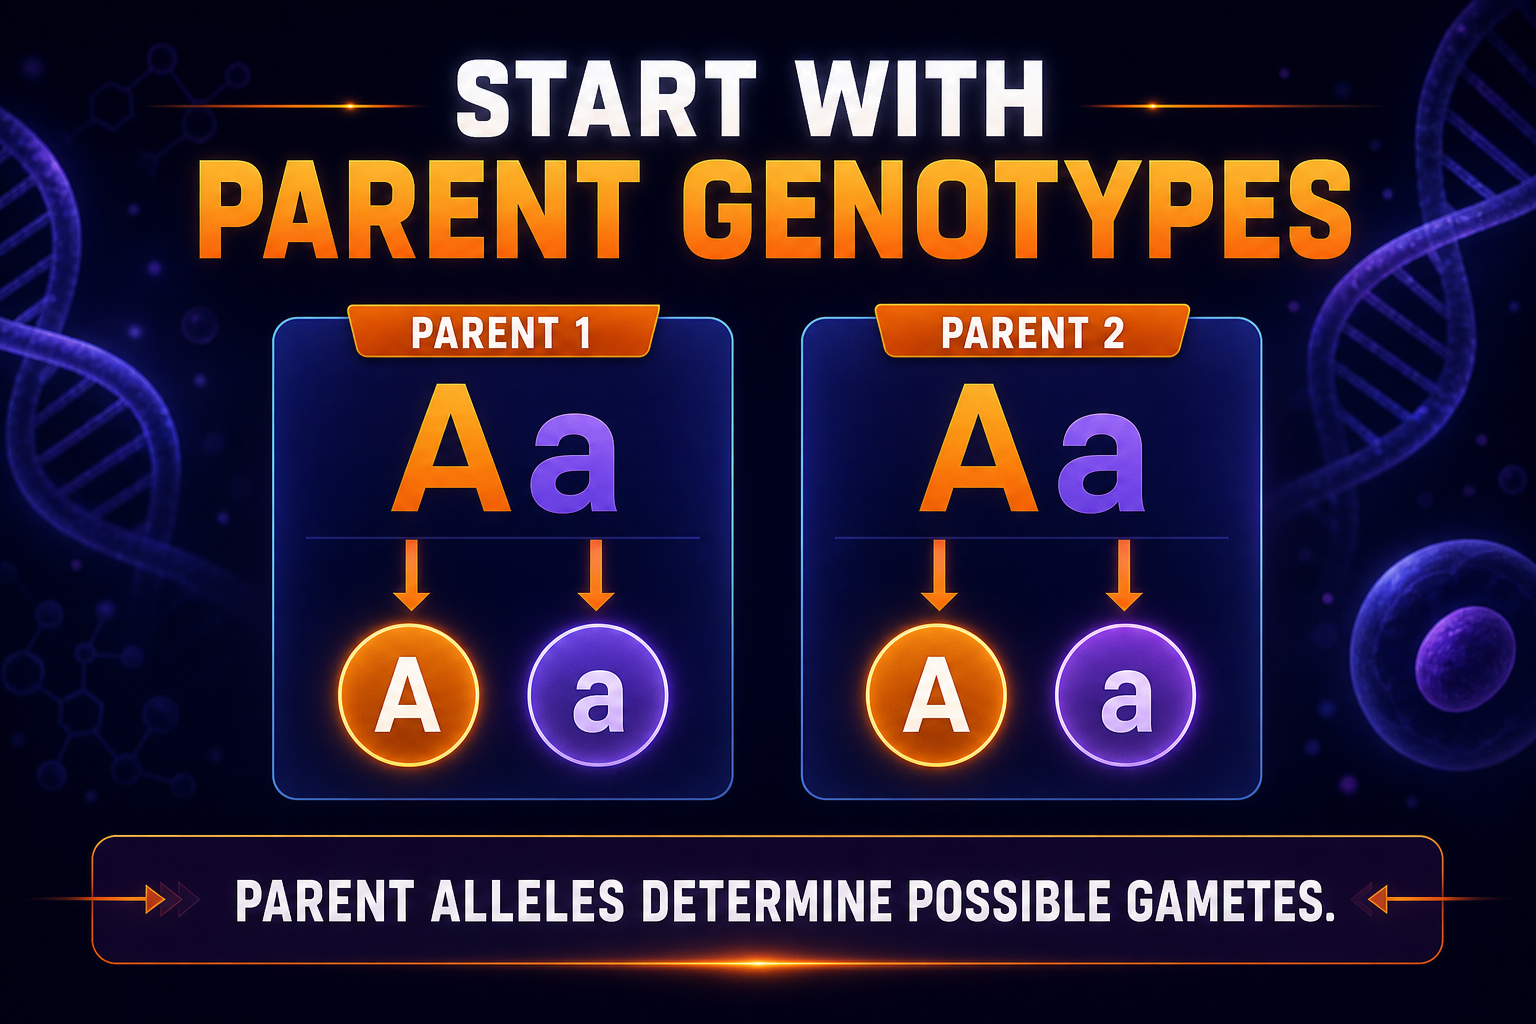
The first step is identifying the genotype of each parent. For example, a heterozygous parent with genotype Aa can make gametes carrying A or a. A homozygous recessive parent with genotype aa can only make gametes carrying a.
Direct answer: A Punnett square starts with parent genotypes, not phenotype labels alone.
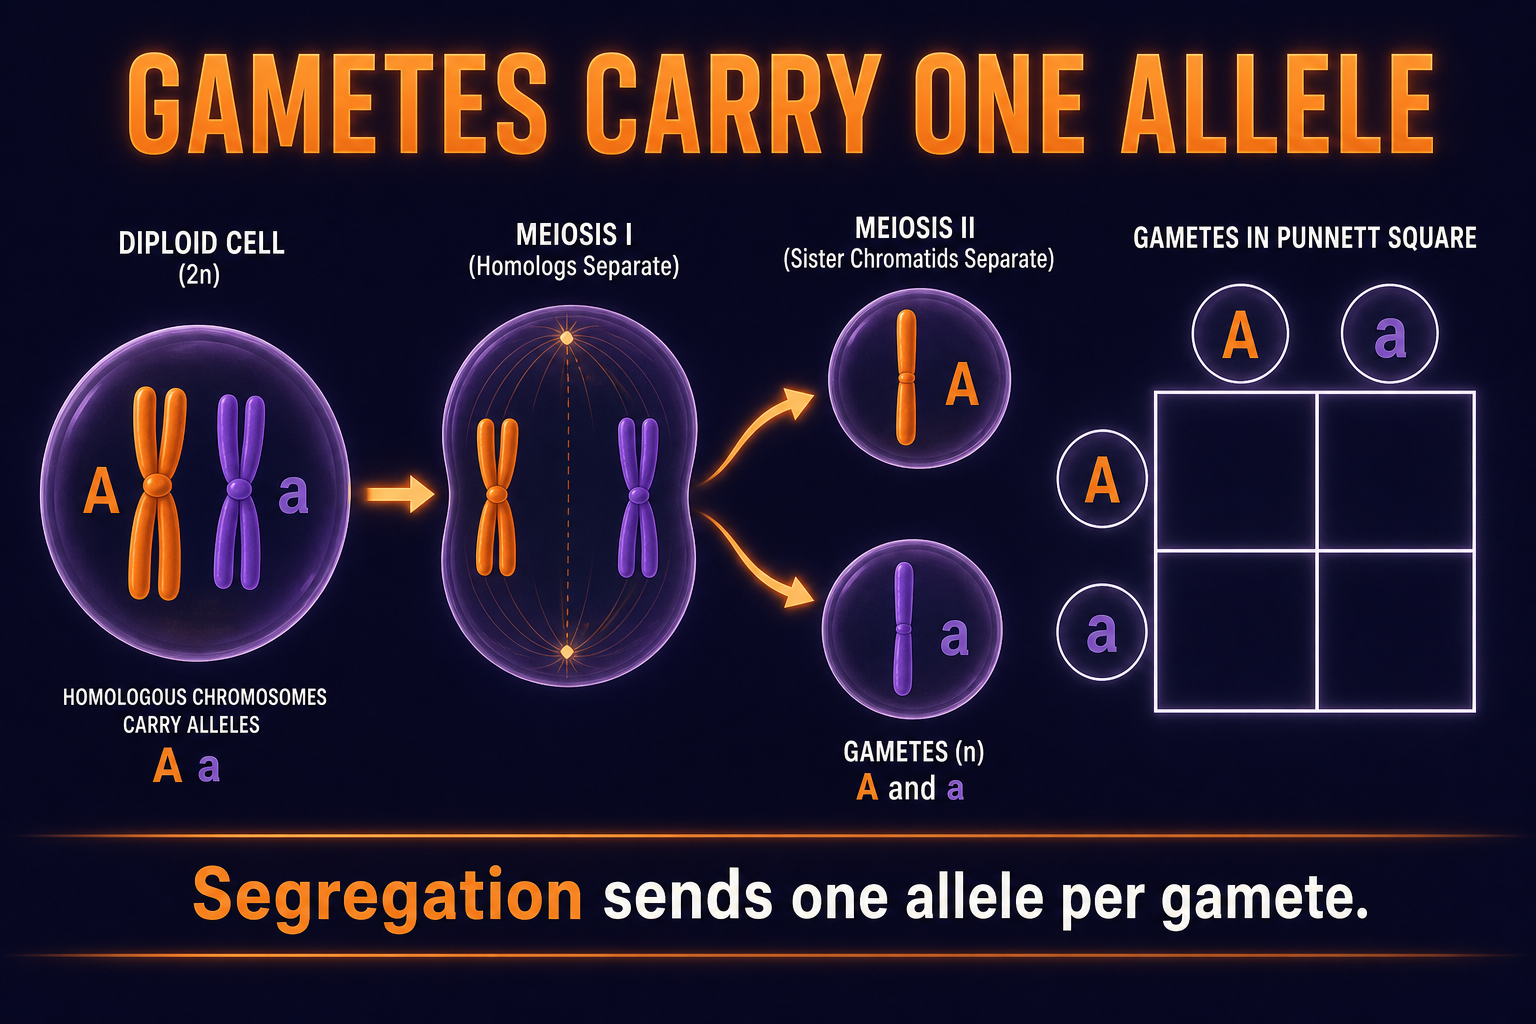
Gametes carry one allele for each gene because alleles segregate during meiosis. In a simple monohybrid cross, an Aa parent can make A and a gametes. Listing gametes correctly is the most important step in how to solve Punnett squares AP Biology questions—get this wrong and every box fails.
Once gametes are placed along the top and side of the square, combine one allele from each parent in every box. Each box represents one possible offspring genotype. For simple dominant-recessive traits, write the dominant allele first, such as Aa instead of aA.
Mini example: Aa × Aa produces possible genotypes: AA, Aa, Aa, aa
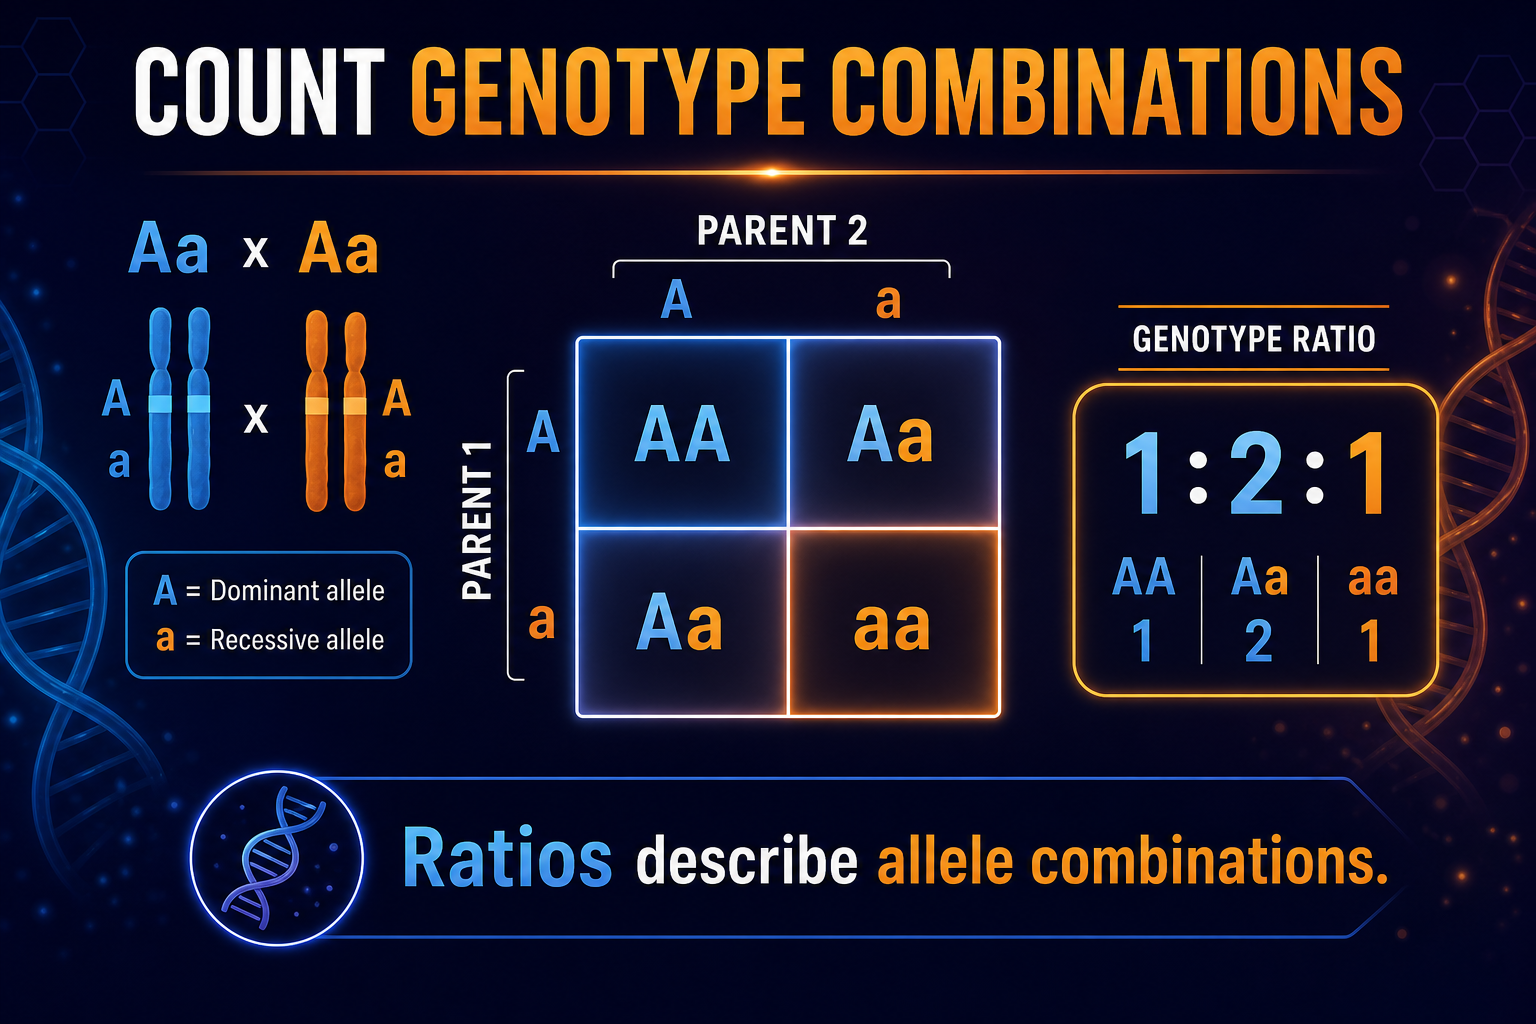
The genotype ratio describes the allele combinations produced by the cross. In an Aa × Aa cross, the genotype ratio is 1 AA : 2 Aa : 1 aa. AP Biology may ask for genotype ratio even when the phenotype ratio looks simpler.
Direct answer: Genotype ratio tells you allele combinations, not visible traits.
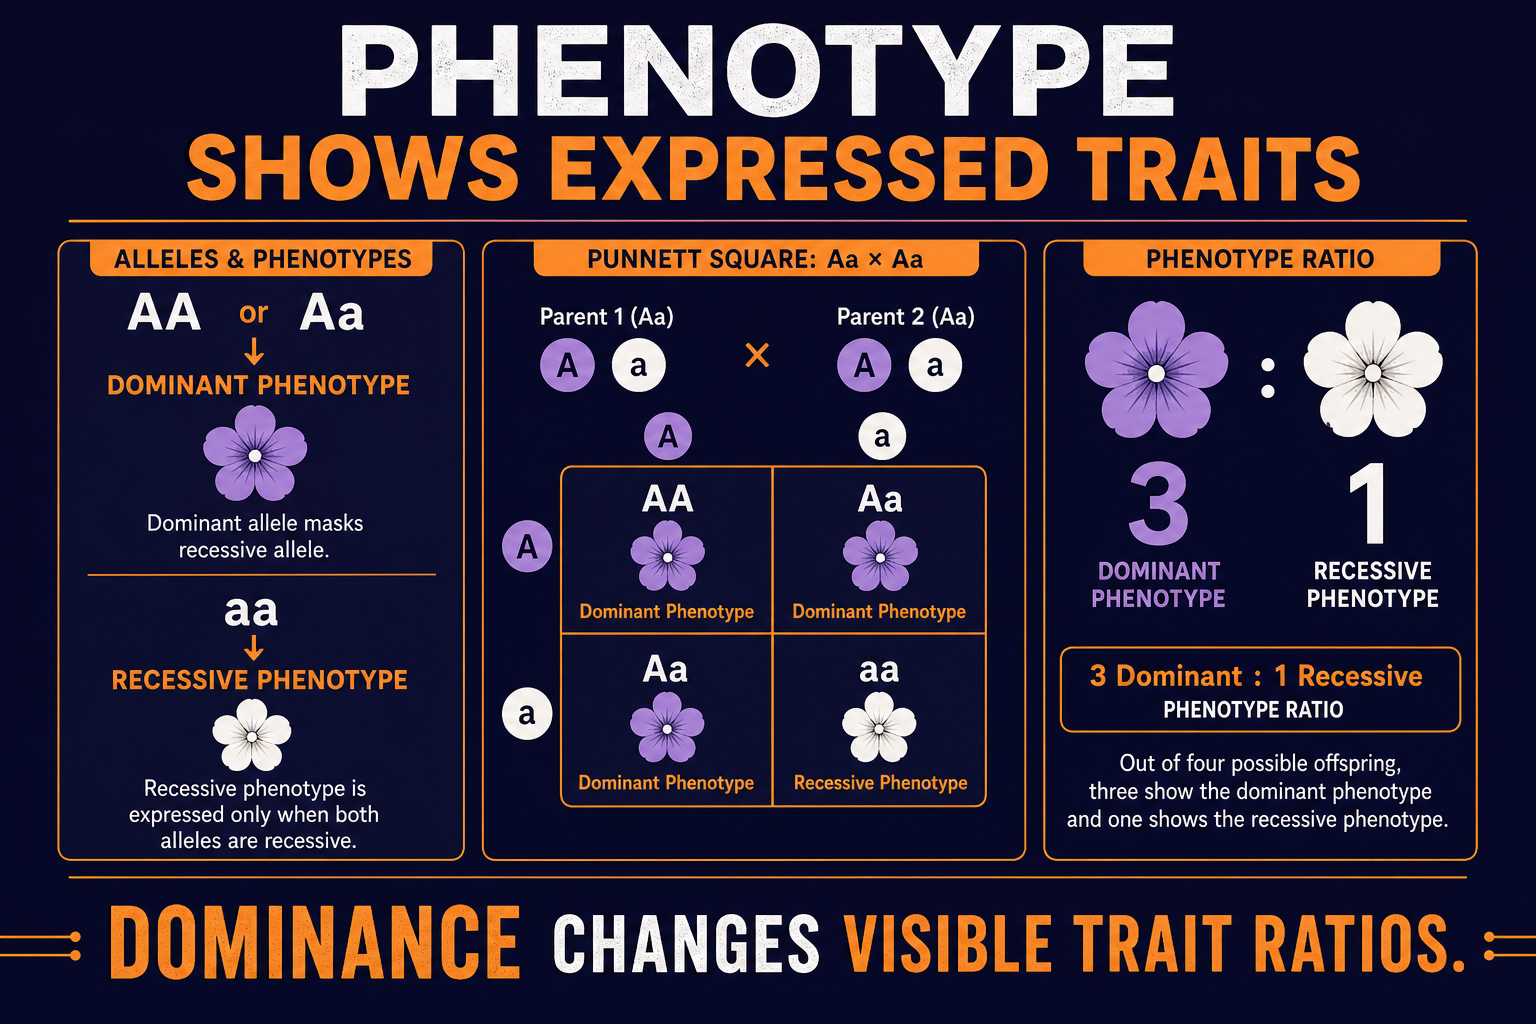
The phenotype ratio depends on the inheritance pattern. In simple complete dominance, AA and Aa show the dominant phenotype, while aa shows the recessive phenotype. That means an Aa × Aa cross gives a 3 dominant : 1 recessive phenotype ratio.
| Cross | Genotype ratio | Phenotype ratio in complete dominance |
|---|---|---|
| AA × aa | 100% Aa | 100% dominant |
| Aa × aa | 1 Aa : 1 aa | 1 dominant : 1 recessive |
| Aa × Aa | 1 AA : 2 Aa : 1 aa | 3 dominant : 1 recessive |
When a problem tracks two genes at once, use the dihybrid crosses guide for FOIL gametes, 4×4 squares, and 9:3:3:1 ratios.
A Punnett square predicts expected probabilities across many offspring or trials. It does not guarantee exact results in a small number of offspring. This is why real observed results may differ from expected ratios, and AP Biology may use chi-square tests to compare observed and expected outcomes.
See the chi-square test for genetics when observed counts are provided.
Use them to list gametes.
Count allele combinations like AA, Aa, aa.
Convert genotypes into expressed traits.
Punnett square probability is being tested.
A chi-square test may be needed.
Simple 3:1 logic may not apply.
State the genotype of each parent before listing gametes.
Each gamete carries one allele for the gene in a monohybrid cross.
Fill the square and count genotype combinations.
Give genotype and phenotype ratios and connect to dominance.
The parents have genotypes ___ and ___. Their possible gametes are ___. The expected offspring genotypes are ___, giving a phenotype ratio of ___.
Fix: Use genotype information whenever the prompt gives it.
Fix: Each gamete carries one allele for the gene.
Fix: Genotype and phenotype ratios are different.
Fix: Punnett squares show expected outcomes, not guaranteed results.
Fix: Check whether the prompt describes non-Mendelian inheritance.
Fix: If observed data are given, compare them with expected results.
Revealed: 0 of 4 scenarios
Parent genotypes are Aa and Aa.
Answer: Each parent can produce A and a gametes, so the cross can produce AA, Aa, and aa offspring genotypes.
A question asks for the genotype ratio.
Answer: Count allele combinations directly, such as 1 AA : 2 Aa : 1 aa.
A question asks for phenotype ratio under complete dominance.
Answer: Convert genotypes into expressed traits. AA and Aa show the dominant phenotype, while aa shows the recessive phenotype.
Observed offspring counts do not match the expected ratio exactly.
Answer: That is normal. Punnett squares show probability, and chi-square can test whether the difference is likely due to chance.
Answer all eight questions. Choices shuffle on reload—focus on mechanism, not letter memorization.
More drills: Unit 5 practice questions, practice by topic, or daily AP Biology practice.
Open each card, draft your response, then reveal the rubric and sample. For more free-response practice, open the Unit 5 FRQ guide.
A plant trait follows complete dominance. A heterozygous plant is crossed with another heterozygous plant.
Each Aa parent can produce A or a gametes. The expected genotype ratio is 1 AA : 2 Aa : 1 aa. With complete dominance, AA and Aa show the dominant phenotype and aa shows the recessive phenotype, so the phenotype ratio is 3 dominant : 1 recessive even though the genotype ratio is 1:2:1.
Status: Draft your answer first—then open the rubric or sample.
A cross is expected to produce a 3:1 phenotype ratio, but the observed offspring are 34 dominant phenotype and 18 recessive phenotype.
A 3:1 ratio means that for many offspring, about three are expected to show the dominant phenotype for every one showing the recessive phenotype. Observed counts can differ because each fertilization is a chance event. A chi-square test can compare the observed 34:18 counts with the expected 3:1 ratio to see whether the difference is likely due to chance.
Status: Draft your answer first—then open the rubric or sample.
A Punnett square is a model that predicts possible offspring genotypes from parent genotypes. It uses gametes from each parent to show possible allele combinations. AP Biology uses Punnett squares to connect inheritance patterns with probability.
Punnett squares show possible genotype combinations and expected probabilities. They can also be used to predict phenotype ratios when the inheritance pattern is known. They do not guarantee exact results for every offspring.
Start by identifying the parent genotypes. Then list the possible gametes from each parent and combine those gametes in the boxes. Finally, count genotype ratios and convert them to phenotype ratios if needed.
A genotype ratio counts allele combinations, such as AA, Aa, and aa. A phenotype ratio counts expressed traits, such as dominant or recessive appearance. In complete dominance, different genotypes can sometimes produce the same phenotype.
A monohybrid Punnett square tracks one gene or trait. For example, Aa × Aa is a monohybrid cross because it follows one allele pair. These crosses are often used to practice 1:2:1 genotype ratios and 3:1 phenotype ratios.
A 3:1 phenotype ratio often appears in a heterozygous monohybrid cross with complete dominance. It means three expected offspring outcomes show the dominant phenotype for every one showing the recessive phenotype. It is a probability pattern, not a guaranteed count.
Punnett squares show expected outcomes based on possible gamete combinations. Real offspring counts can differ from expected ratios because fertilization events involve chance. Larger sample sizes usually get closer to expected ratios.
Yes, but the interpretation changes depending on the inheritance pattern. In incomplete dominance or codominance, heterozygotes may have a phenotype different from either homozygote. The square still shows genotypes, but phenotype ratios must be interpreted using the correct pattern.
Punnett squares depend on gametes, and gametes are produced by meiosis. Alleles segregate into gametes during meiosis, which is why each gamete carries one allele for a gene. The square models how those gametes can combine during fertilization.
Show your reasoning instead of only giving a final ratio. Identify parent genotypes, list gametes, predict offspring genotypes, and explain the phenotype ratio. If observed data are included, compare them with the expected ratio.