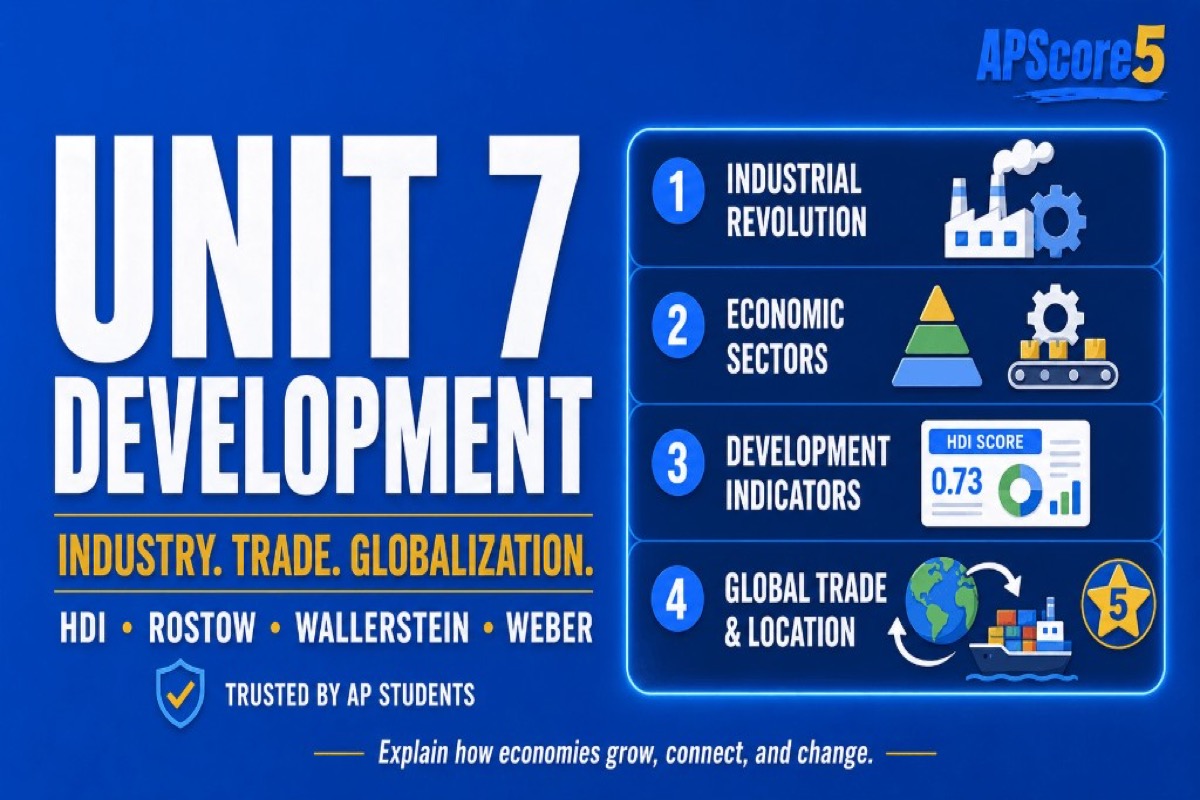
AP Human Geography Unit 7Industry & DevelopmentTheories + Weber12–17% of MCQs
AP Human Geography Unit 7: Industrial and Economic Development Patterns and Processes
Master development indicators, economic sectors, world-systems theory, industrial location, Weber's least-cost theory, outsourcing, special economic zones, and sustainable development with AP-style practice.
Updated June 1, 2026 • Reviewed by APScore5 Editorial Team
AP Human Geography Unit 7 studies industrial and economic development patterns and processes. It explains how countries measure development, why development is uneven, where industries locate, how global supply chains organize production, and how trade, labor, technology, and sustainability shape economic geography.
Say it fast: Unit 7 = development indicators, development theories, factory location, globalization, and sustainability.
AP clue: If the question mentions GDP, GNI, HDI, Gini, Rostow, Wallerstein, core-periphery, Weber, outsourcing, offshoring, SEZs, deindustrialization, or sustainable development, think Unit 7.
Industry, indicators, theories, location, trade, and sustainability in one map.
AP Human Geography Unit 7 is where students learn why some places become wealthy and industrialized while others remain tied to raw materials, low-wage assembly, or uneven trade. The AP exam wants you to explain mechanisms—how indicators, theories, and factory location decisions create spatial patterns—not memorize lists.
Unit 7 connects development indicators, economic sectors, development theories, industrial location, global trade, and sustainability.
1
Industrial takeoff — coal, capital, and transport concentrated early manufacturing in Britain before uneven global diffusion.
Expect roughly 12–17% of AP Human Geography multiple-choice items from this unit. FRQs often blend tables (GDP, literacy, Gini) with explanation prompts about theory or factory location. Review Unit 1 data skills, Unit 4 trade politics, and Unit 6 urban labor shifts when prompts cross units.
Primary work extracts resources—farming, fishing, mining. Secondary transforms inputs into goods. Tertiary sells services; quaternary handles information and R&D; quinary captures elite decision-making.
A rising share of tertiary and quaternary jobs often signals postindustrial change, but a large informal sector means official stats understate precarity. Compare sector pies with the economic sectors guide and industrialization patterns.
🎯AP clue: Never claim “developed” from sector data alone—name what the chart shows and what it hides.
📊
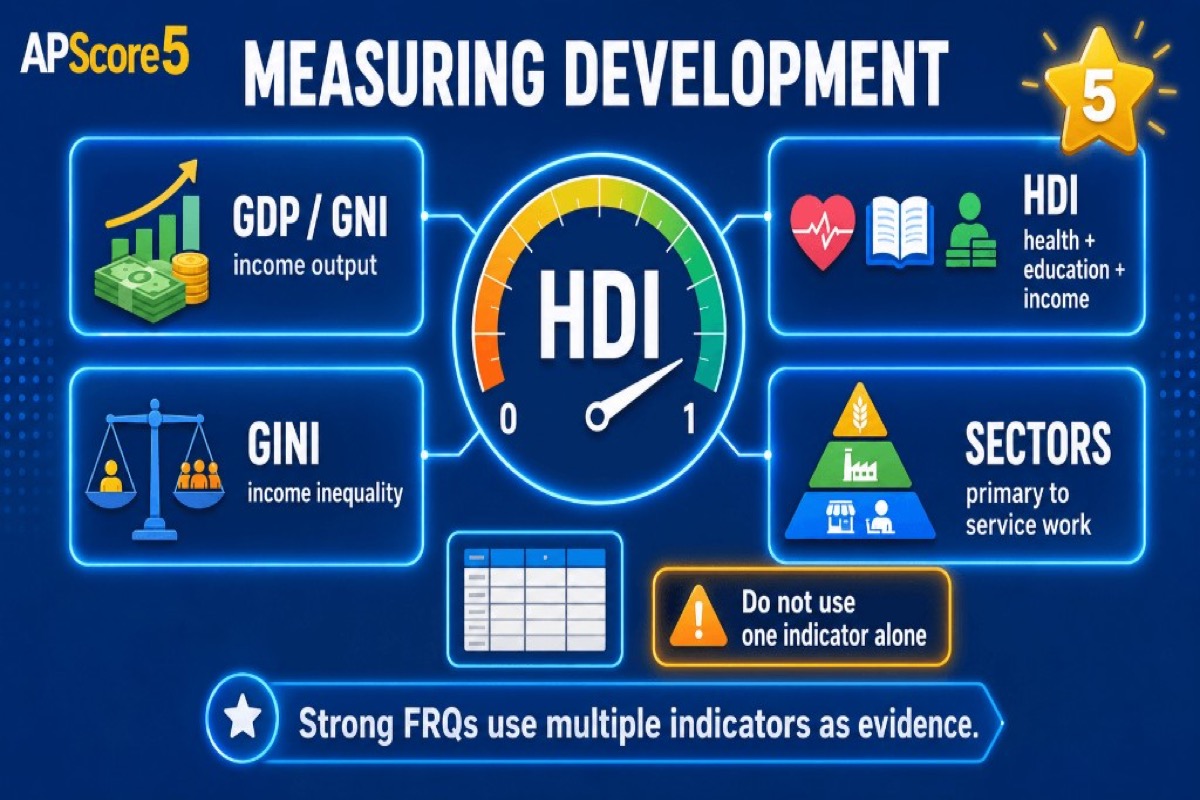
Development Indicators: Numbers That Need Interpretation
Measures of development include GDP, GNI, PPP adjustments, and per capita averages. None shows distribution by itself—always ask who benefits.
Indicator
Measures
Blind spots
AP clue
GDP / GNI
Output or resident income
Inequality, informal work, environmental cost
Pair with Gini when stimulus shows stratification
Per capita
Average material conditions
Masks top-heavy wealth
High average + high Gini = unequal boom
PPP
Cost-of-living adjusted compare
Still national scale
Explains shrinking nominal gaps
Infant mortality
Health system stress
Recording bias
Spikes signal crisis
Mini example: Country A posts high GDP per capita and high Gini—argue averages hide concentrated wealth, not universal comfort.
📈
HDI, Gini, Literacy, and Gender Gaps
Human Development Index (HDI) blends health, education, and income into one score—useful for cross-country compare, weak on within-country inequality.
Gini measures income concentration (higher = more unequal). GII tracks gender gaps in health, empowerment, and labor. Female literacy and labor-force participation often link to broader development outcomes—explain institutions, not stereotypes.
🌐
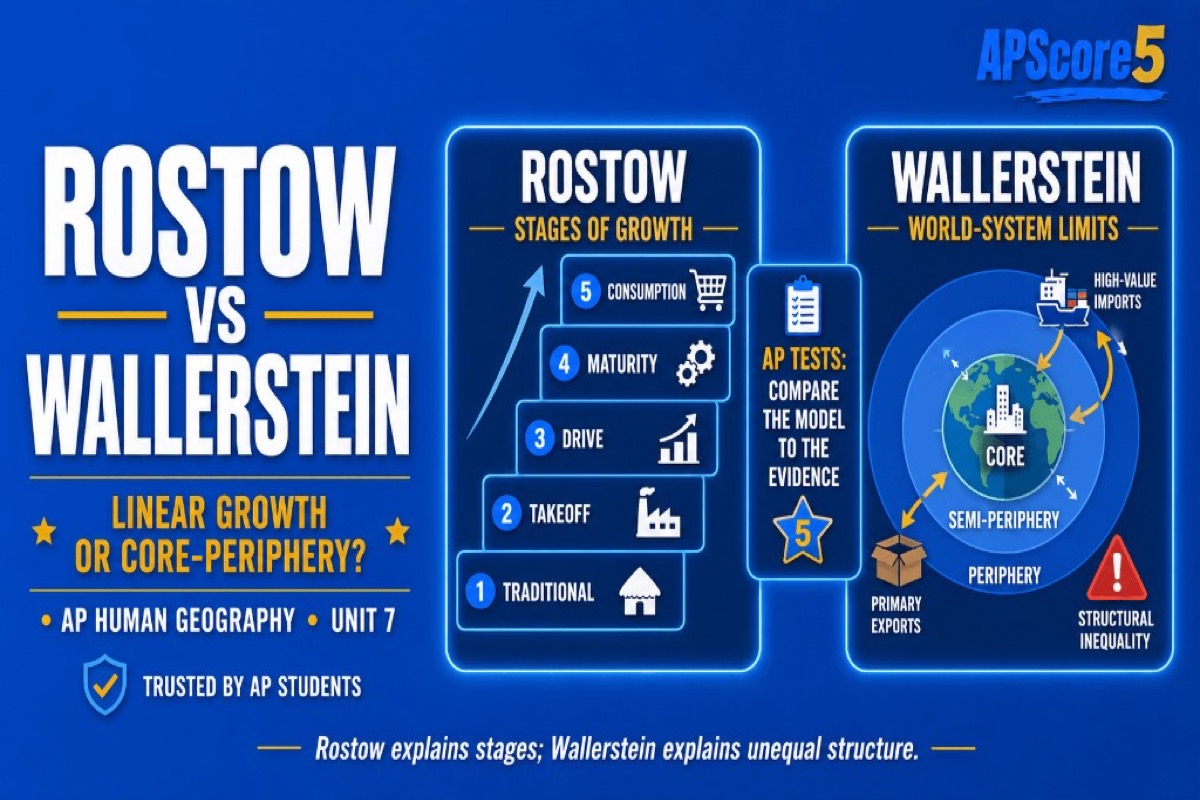
Development Theories: Rostow vs Wallerstein
Rostow framed modernization as staged investment toward mass consumption. Wallerstein emphasized imperial history and uneven surplus flowing to cores.
Rostow explains development as stages, while Wallerstein explains development through unequal core, semi-periphery, and periphery relationships.
Core regions concentrate finance, R&D, and corporate control. Periphery regions often export raw materials or low-wage assembly under dependent terms. Semi-periphery states can move between roles (industrializing exporters with uneven internal inequality).
On FRQs, name the function in the world economy—who designs, who finances, who assembles—and cite stimulus evidence (FDI flows, commodity prices, ownership).
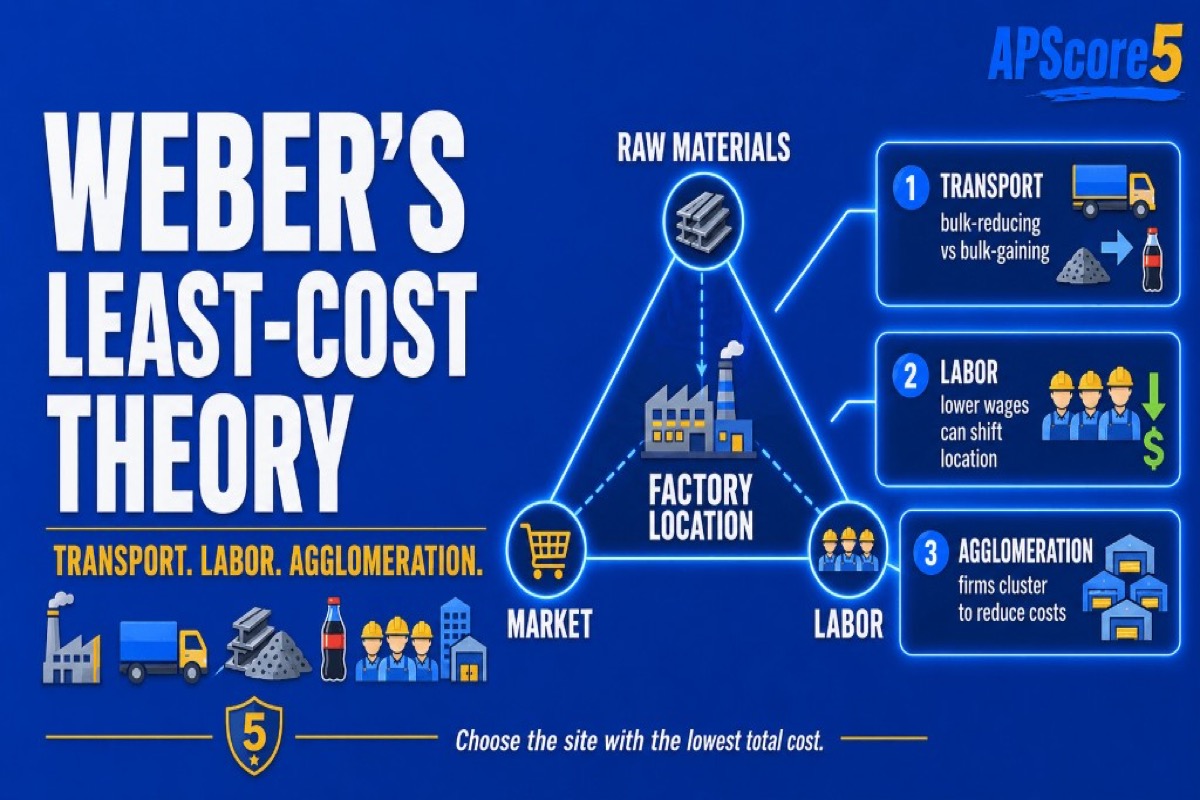
Bulk-reducing (steel) — orient toward inputs; weight lost in processing.
Bulk-gaining (beverages) — orient toward markets when water or weight is added late.
Footloose (chips, software) — talent and capital matter more than ore.
Industrial location decisions depend on transportation, labor, agglomeration, markets, raw materials, and global supply-chain connections.
See also agglomeration for why firms cluster despite higher rents.
🏗️
Agglomeration and Industrial Regions
Agglomeration saves shared infrastructure, supplier networks, and skilled labor pools—Silicon Valley, Guangdong electronics, or automotive corridors. Economies of scale lower per-unit cost as output rises.
Exam items may contrast agglomeration with deindustrialization when clusters hollow out. Link to the agglomeration study guide for FRQ language on clusters vs isolated plants.
🚢
Globalization, Outsourcing, and Offshoring
Outsourcing contracts work to another firm; offshoring moves production across borders—they overlap but are not identical. The new international division of labor (NIDL) splits design, assembly, and logistics across wage zones.
TNCs and FDI reorganize supply chains; benefits (jobs, technology transfer) often sit beside risks (wage pressure, environmental harm, dependency). Read outsourcing and offshoring for balanced AP paragraphs.
🏢
SEZs, EPZs, and Maquiladoras
Special economic zones (SEZs) and export processing zones (EPZs) use tax breaks and streamlined rules to attract foreign plants. Maquiladoras on the U.S.–Mexico border assemble for export markets.
Strong answers note who profits, wage levels, environmental enforcement, and whether linkages stay shallow. Study SEZs in depth before test day.
⚙️
Deindustrialization and Regional Change
Deindustrialization is long-run manufacturing job loss from automation, competition, or relocation—classic in the U.S. Rust Belt and older European industrial belts. Consequences include unemployment, out-migration, brownfields, and weaker municipal budgets.
Recovery mixes retraining, cleanup, transit investment, and new sectors—not assuming old mills return. Industrialization and deindustrialization guide walks through causes and policy responses.
♻️
Sustainable Development
Sustainable development balances economic growth, social equity, and environmental protection across generations. GDP growth fails the test if pollution concentrates in marginalized neighborhoods or wages stay too low to support health.
Anchor answers with UN Sustainable Development Goals, environmental justice, and circular economy ideas. Open the sustainable development guide for exam-ready examples.
🧩
Unit 7 Concept Sorter
Classify each clue as an indicator, theory, location factor, trade pattern, or sustainability issue.
Loading concept sorter…
🔬
10-Question Unit 7 Diagnostic
See whether indicators, theories, or Weber logic costs you time.
Question 1 of 10Unit 7 Industry
🃏
Unit 7 Flashcards (60)
Two-sentence backs: definition plus exam usage.
Card 1 of 60Tap card to flip
✅
Unit 7 MCQ Practice (50)
✓0Correct
#0Answered
%0%Accuracy
★StartStatus
Question 1 of 50Unit 7 Industry
📝
FRQ Practice: Explain the Economic Geography
Compare weak one-liners with evidence-rich strong answers.
📝
Prompt — Development indicators
A country has rising GDP per capita but a high Gini coefficient and low female literacy. Explain why GDP alone is not enough to measure development.
Weak answer: GDP shows the country is rich.
Strong answer: GDP per capita shows average income, but it can hide inequality because a high Gini coefficient means income is unevenly distributed. Low female literacy also suggests limits in education and opportunity, so economic growth may not improve development for all groups.
📝
Prompt — Rostow vs Wallerstein
A country exports raw materials, imports expensive manufactured goods, and depends heavily on foreign investment. Explain which development theory best fits this pattern.
Weak answer: Rostow because the country is developing.
Strong answer: This pattern fits Wallerstein's world-systems theory because the country appears to occupy a peripheral role: it supplies raw materials and depends on core countries for capital, technology, and higher-value manufactured goods.
📝
Prompt — Weber and industrial location
A soft-drink bottling company builds factories near major urban markets instead of near sugar suppliers. Explain this location decision using Weber's least-cost theory.
Weak answer: They want to be near customers only.
Strong answer: Soft-drink bottling is market-oriented because water is added near consumers, making the finished product heavier and costlier to ship long distances. Locating near major markets lowers transportation costs for bulky finished goods.
📝
Prompt — Deindustrialization
A former manufacturing region loses factories as companies move production overseas or automate. Explain one economic consequence and one possible policy response.
Weak answer: Jobs leave and nothing can be done.
Strong answer: Deindustrialization can reduce employment, weaken the local tax base, and leave brownfields. Workforce retraining plus brownfield redevelopment can attract new industries instead of assuming old mills return.
📝
Prompt — Sustainable development
A country attracts foreign factories that increase exports but also create pollution and low-wage working conditions. Explain why this may not be sustainable development.
Weak answer: Exports always mean development.
Strong answer: Factories may raise exports and jobs, but sustainable development also requires social equity and environmental protection. Growth built on pollution and very low wages creates long-term human and environmental costs.
🚫
Common Unit 7 Mistakes
Treating GDP as the same as development
Wrong idea: High GDP means the country is fully developed.
Better idea: GDP measures economic output, not health, education, equity, or sustainability—pair it with HDI and inequality data.
Confusing GDP and GNI
Wrong idea: GDP and GNI always measure the same thing.
Better idea: GDP counts production inside borders; GNI counts income to residents, including money earned abroad.
Unit 7 studies industrial and economic development patterns and processes. You learn how countries measure development, why wealth is uneven, where factories locate, how global supply chains work, and how trade, labor, technology, and sustainability shape economic geography.
What are the main topics in AP Human Geography Unit 7?
Main topics include economic sectors, development indicators (GDP, GNI, HDI, Gini), Rostow and Wallerstein, core-periphery and dependency theory, Weber's least-cost theory, agglomeration, outsourcing and offshoring, SEZs and maquiladoras, deindustrialization, and sustainable development.
What is the difference between GDP, GNI, HDI, and Gini?
GDP totals production inside borders; GNI counts income to residents including earnings abroad. HDI blends health, education, and income into one score. The Gini coefficient measures income inequality—higher values mean wealth concentrates among top earners.
What is Rostow's model in AP Human Geography?
Rostow's modernization theory describes five stages from traditional society to high mass consumption, assuming countries can climb a development ladder through investment and technology. Critics note it can overlook colonial extraction and structural trade disadvantages.
What is Wallerstein's world-systems theory?
Wallerstein maps the global economy into core, semi-periphery, and periphery roles based on finance, manufacturing, and raw-material flows. Core countries concentrate high-value work; peripheries often export cheaper inputs under dependent relationships.
What is Weber's Least Cost Theory?
Weber models factory location as minimizing transport, labor, and agglomeration costs together. Bulk-reducing industries hug inputs; bulk-gaining industries chase markets; labor savings or clusters can override pure shipping math.
What is the difference between outsourcing and offshoring?
Outsourcing contracts work to another firm but may stay domestic. Offshoring moves production or services to another country to reduce costs or access labor—often part of global supply chains.
What is deindustrialization?
Deindustrialization is long-run loss of manufacturing jobs from automation, competition, or relocation—often shrinking tax bases and leaving brownfields in older industrial belts like the U.S. Rust Belt.
What is sustainable development in AP Human Geography?
Sustainable development balances economic growth with social equity and environmental protection across generations. GDP gains fail the test if pollution concentrates in marginalized areas or wages stay too low to support health.
How should I study for AP Human Geography Unit 7?
Alternate indicator drills (GDP vs HDI vs Gini) with theory contrasts (Rostow vs Wallerstein). Sketch Weber scenarios daily, run flashcards and MCQs here, and finish with concise FRQ rehearsals that cite evidence from stimuli.
→
Continue learning
Wrap AP Human Geography Units 1–7
You now have the full AP Human Geography unit sequence on APScore5—rotate mixed practice before exam day.