Describe
Identify the visible age-sex pattern
Prompt cue: "Describe the population structure shown..."
Students who can describe a pyramid shape still lose FRQ points when they cannot connect that shape to fertility, dependency, migration, or a DTM stage.
Population pyramids AP Human Geography questions ask you to do more than name a shape. The exam tests whether you can read age-sex structure as evidence of birth rates, death rates, dependency, migration, and a country's stage in the Demographic Transition Model.
New to pyramids? Start with the Population Pyramids overview, then return here for exam strategy.
This guide is Step 2 of 4 inside Unit 2: Population and Migration. For the 5-step reading walkthrough, open how to read population pyramids.
Step 2 turns pyramid knowledge into AP-style answers.
Start here if you only have two minutes — then jump to skills, FRQ method, or practice.
Three question types cover almost every pyramid prompt on the exam.
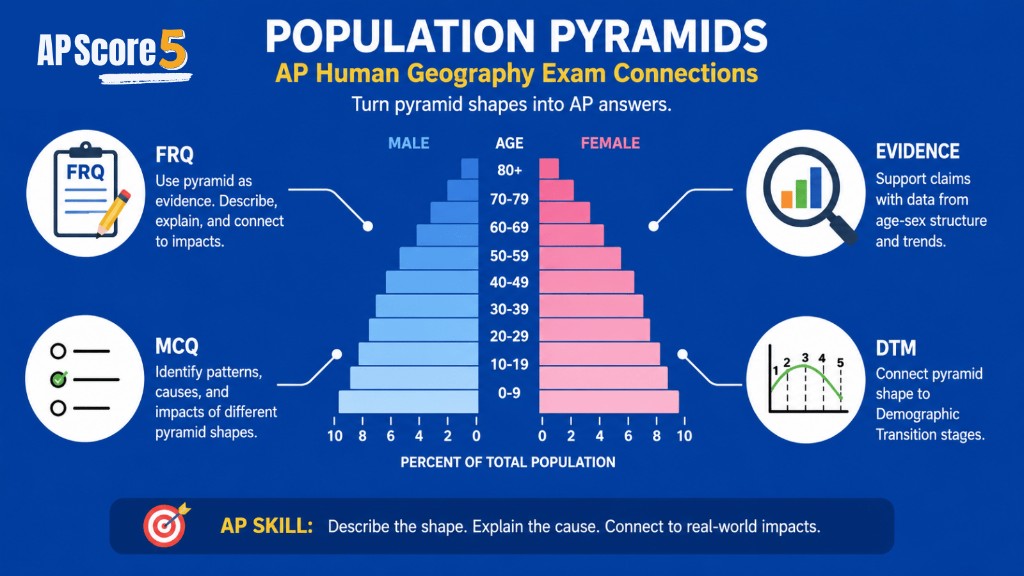
A pyramid image plus four answer choices
Name the trend, stage, or consequence the graph supports
Terms tied to age structure and rates
Use precise words: CBR, TFR, dependency, momentum
Free-response with describe / explain / predict verbs
Write Pattern → Cause → Effect in about three sentences
College Board stimuli usually pair a pyramid with one or two rate statistics. Your job is to translate the visual into demographic vocabulary, then into consequences planners care about — schools, pensions, labor supply, or migration policy.
Multiple-choice items often ask which stage of the Demographic Transition Model best fits the graph, which dependency type is rising, or which policy would address the trend. Free-response items add verbs: describe, explain, compare, predict. Read the verb first; it tells you how many sentences and whether you need a because clause.
If you landed here from search, skim the Population Pyramids overview for parts and shapes, then return to this page for scoring language. Ready to practice reading? Continue to how to read population pyramids after you finish the FRQ method below.
Read the verb in the prompt first — it tells you what kind of sentence earns the point.
Identify the visible age-sex pattern
Prompt cue: "Describe the population structure shown..."
Connect the pattern to fertility, mortality, or migration
Prompt cue: "Explain one demographic cause of this pattern..."
Contrast two countries or two shapes
Prompt cue: "Compare the age structures of Country X and Country Y..."
Infer future growth, aging, or dependency
Prompt cue: "Predict one challenge this country will face..."
Use the pyramid as evidence in an FRQ argument
Prompt cue: "Using the graph, support a claim about..."
| AP Skill | What the question asks you to do | Example prompt phrase |
|---|---|---|
| Describe | Identify the visible age-sex pattern | "Describe the population structure shown..." |
| Explain | Connect the pattern to fertility, mortality, or migration | "Explain one demographic cause of this pattern..." |
| Compare | Contrast two countries or two shapes | "Compare the age structures of Country X and Country Y..." |
| Predict | Infer future growth, aging, or dependency | "Predict one challenge this country will face..." |
| Apply | Use the pyramid as evidence in an FRQ argument | "Using the graph, support a claim about..." |
Every pyramid FRQ uses at least two of these verbs. Read the verb first — it tells you what kind of answer earns the point.
On compare prompts, name one difference per country and tie each difference to fertility, mortality, or migration. On predict prompts, use will likely language and pick one concrete effect — jobs, health care, housing, or political pressure.
On the AP HUG exam, population pyramids AP Human Geography items rarely stand alone. They sit inside Unit 2 themes — fertility, mortality, migration, policy, and resources. Use the blocks below as a checklist before you write any free-response paragraph.
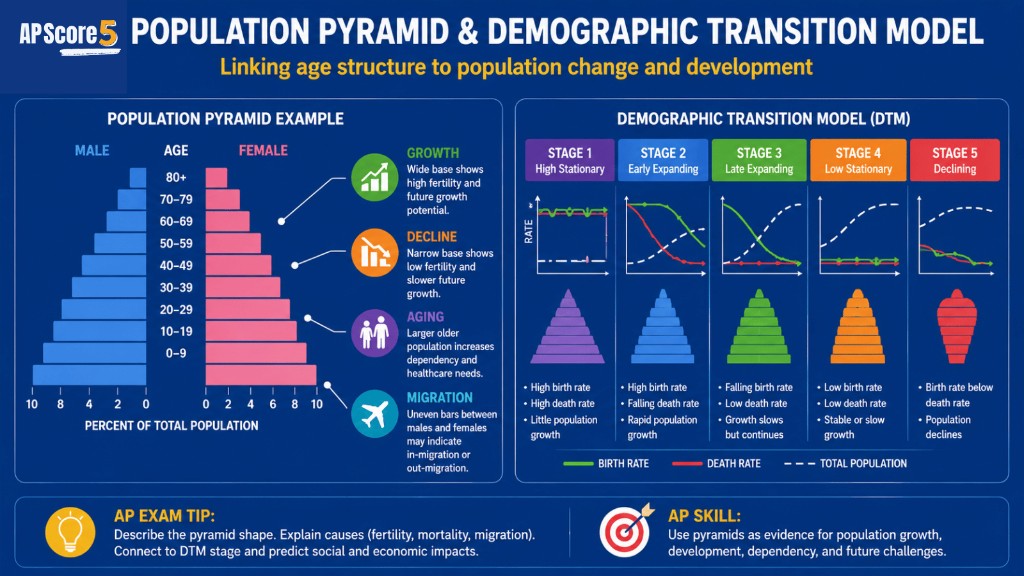
Demographic Transition Model. In one sentence: each pyramid shape maps to a DTM stage, so a shape is also a stage diagnosis. A wide-base pyramid usually signals DTM Stage 2 or early Stage 3. A near-rectangle signals Stage 4. A top-heavy pyramid signals Stage 5. Open the full Demographic Transition Model guide for the stage-by-stage breakdown.
When a stimulus shows both rates and a pyramid, your answer should reconcile them. If CBR is still high but the base is narrowing, you may be watching a country move from Stage 2 into Stage 3 — momentum can keep totals rising even as fertility falls.
Fertility and mortality. In one sentence: the base reads fertility, the top reads mortality and life expectancy. High CBR widens the base; falling IMR thickens the lower middle; rising life expectancy widens the top.
Exam writers love swapping cause and effect. A wide base is evidence of high fertility — not proof that the country will stay poor forever. Likewise, a wide top reflects longevity and cohort history, not automatic wealth.
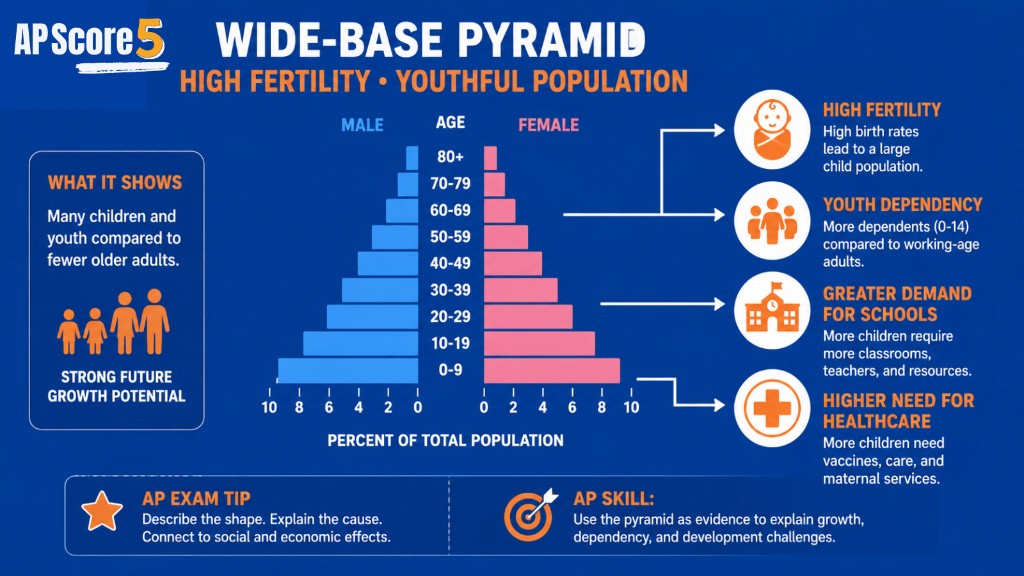
Dependency ratio. In one sentence: a pyramid is the fastest visual estimate of dependency. Wide base = high youth dependency. Wide top = high elderly dependency. Both press on the working-age middle.
When a prompt asks about schools or pensions, translate the pyramid into dependency language before you predict policy. Compare your read to the Unit 2 Overview notes on dependency if the question blends themes.
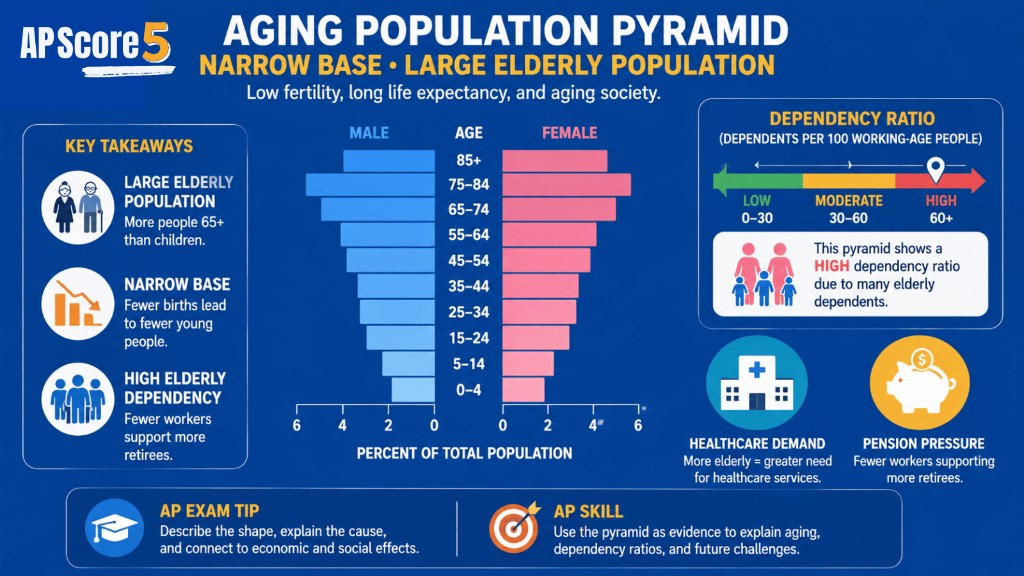
Demographic momentum. In one sentence: even after fertility falls, a wide base means the population keeps growing for decades. This is the AP exam's favorite trap — the country's TFR can be at replacement and population still rises.
Bangladesh and India often appear in items that test this idea. Your written answer should name momentum explicitly when the base is wide but the prompt says birth rates are declining.
Migration (Ravenstein, push–pull). In one sentence: missing or extra cohorts in young adult ages usually signal migration. Male-heavy young adults in a Gulf state, female-heavy young adults in a remittance-sending country — both readable on the pyramid.
Never claim migration without citing the bar pattern. Uneven left-right sides at working ages are your evidence. Pair migration vocabulary with the push or pull factor that fits the region in the prompt.
Malthus and resources. In one sentence: a wide-base pyramid raises Malthusian pressure on food, water, and jobs. See Malthusian Theory when a question asks whether growth outruns resources.
Pyramids show composition; Malthus debates limits. A strong FRQ links a youthful pyramid to near-term demand for schools and jobs, then names one resource stress if the prompt asks for consequences.
Memorize this table — it is the fastest way to connect a pyramid silhouette to a stage on MCQs and FRQs.
This table is the highest-yield link between pyramids and the Demographic Transition Model on the AP exam. Memorize the shape clue column, then practice with the MCQs below.
| DTM Stage | Typical pyramid shape | Pyramid clue | Country examples often cited |
|---|---|---|---|
| Stage 1 | Wide base, very narrow top | High CBR, high CDR | Pre-industrial societies (rare today) |
| Stage 2 | Very wide base, narrow top | High CBR, falling CDR | Niger, Afghanistan |
| Stage 3 | Narrowing base, growing middle | Falling CBR | India, Mexico |
| Stage 4 | Rectangular | Low CBR, low CDR | United States, France |
| Stage 5 | Narrow base, wide top | CBR below CDR | Japan, Italy, South Korea |
Want the full DTM walkthrough with country case studies? Open the Demographic Transition Model guide.
Stage labels on the exam are not always neat. A country can show a wide base while birth rates are already falling — that is early Stage 3 momentum, not pure Stage 2. Cite base width and middle thickness together when you assign a stage.
25 AP-exam terms for pyramid stimuli. Tap to flip; rate Got it or Practice more.
Scorers listen for precise terms — dependency ratio, demographic momentum, replacement-level fertility — instead of vague phrases like young country. Say each definition aloud before you flip.
Use this formula on every free-response that shows a pyramid — about three sentences total.
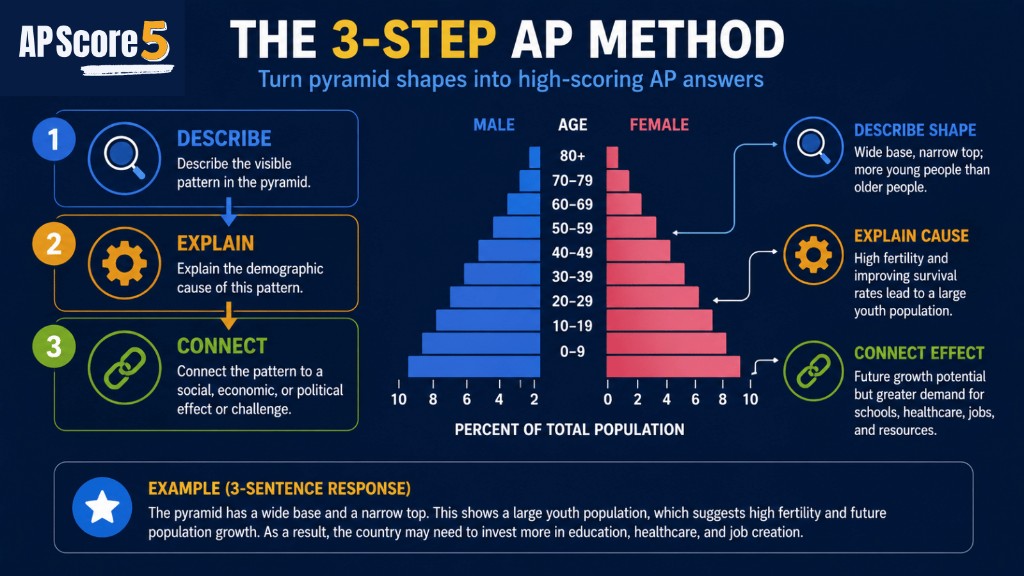
Pattern → Demographic Cause → Human Geography Effect
Pattern: The pyramid has a wide base, showing a large youth population.
Demographic Cause: This suggests a high total fertility rate, often because of limited contraception access, early marriage, and rural economic structures.
Effect: The country will face rising demand for schools, primary healthcare, and entry-level jobs over the next 20 years.
If your answer sounds like the trap column, rewrite it using the better AP phrasing.
Trap: “The country is poor because the pyramid is wide.”
Better AP answer: The wide base suggests high fertility and a youthful population, consistent with DTM Stage 2 or early Stage 3.
Trap: “The top is small, so no one is old.”
Better AP answer: A narrow top usually means lower life expectancy or a smaller elderly population, often tied to earlier DTM stages.
Trap: “This pyramid shows migration for sure.”
Better AP answer: Migration may explain uneven cohorts, but the answer must cite the specific bar pattern as evidence.
Trap: “The country will keep growing forever.”
Better AP answer: A youthful population creates growth momentum, but future growth depends on fertility trends and migration.
Trap: “Wide base = Stage 2.”
Better AP answer: Wide-base pyramids cluster in Stage 2 and early Stage 3; cite the base and middle together.
Trap: “FRQ said "explain" so I described.”
Better AP answer: "Explain" requires a because; description alone caps your score.
This page covers exam strategy. Page 3 teaches the hands-on reading method. Preview the five steps:
Shape names — expansive, stationary, constrictive — are compared on types of population pyramids (Step 4).
30 MCQs with rising difficulty and live scoring.
Questions mix pyramid interpretation with Unit 2 population concepts and DTM links. Read every explanation — pyramids on the AP HUG exam reward reasoning, not memorized letters.
Open each scenario, write your three sentences, then compare to the model. Expanding a scenario counts toward your FRQ progress tracker.
Prompt: A country's pyramid has a very wide base, a thin middle, and a small top. Identify one demographic trend. Explain one cause using DTM Stage 2 or 3 vocabulary. Predict one Malthusian challenge — food, water, or jobs.
Model answer (Pattern → Cause → Effect): Pattern: rapid natural increase with high youth dependency. Demographic cause: high total fertility rate with falling infant mortality, typical of DTM Stage 2 moving toward Stage 3. Effect: rising demand for food, water, schools, and entry-level jobs — Malthusian pressure if resources do not keep pace.
Prompt: A country's pyramid has a narrow base, a large 40–60 cohort, and a growing 70+ cohort. Identify one demographic trend. Explain one cause beyond low fertility. Predict one government policy response (pronatalist, immigration-driven, or pension reform).
Model answer (Pattern → Cause → Effect): Pattern: aging society with shrinking youth share and rising elderly dependency. Cause: decades of below-replacement fertility plus rising life expectancy; optional second cause: limited immigration of young workers. Effect: likely policy mix of pension reform, pronatalist incentives, or immigration programs to support the workforce.
Memorize the 3-sentence formula and write one practice answer.
Flip all 25 vocab cards; mark weak ones for extra review.
Answer 10 MCQs; time-box at 8 minutes.
Open the Demographic Transition Model guide and re-create the lookup table from memory.
Write FRQ Scenario 1 in 7 minutes; compare to the model answer.
Open how to read population pyramids and try the 5-step method on one stimulus.
Mixed practice: 15 MCQs plus FRQ Scenario 2.
Sign up free to save weak FRQ verbs and finish all four Population Pyramid guides.
Daily practice that adapts to your weak topics.
Describe vs explain vs predict — see what you miss.
One click, full mini-course.
Yes. Population pyramids appear on AP Human Geography exams as multiple-choice stimulus items, vocabulary questions, and free-response evidence. You are expected to describe age-sex structure, explain demographic causes, and connect patterns to the Demographic Transition Model or dependency.
Population pyramids are taught in Unit 2: Population and Migration Patterns and Processes. They connect to fertility, mortality, aging, migration, population policies, and the Demographic Transition Model.
FRQs often show a pyramid and ask you to describe a trend, explain one demographic cause, and predict a consequence. The highest-scoring answers use Pattern → Cause → Effect in about three sentences and name a specific mechanism such as fertility decline or guest-worker migration.
Each DTM stage tends to produce a characteristic pyramid shape: very wide bases in Stage 2, narrowing bases in Stage 3, rectangular profiles in Stage 4, and top-heavy constrictive shapes in Stage 5. The pyramid is visual evidence of where a country sits on the model.
Sentence 1 states the visible pattern (wide base, aging top, cohort bulge). Sentence 2 explains the demographic cause using fertility, mortality, or migration vocabulary. Sentence 3 predicts a human geography effect such as school demand, pension pressure, or labor shortage.
A wide base means a large share of young people, usually signaling high fertility and high youth dependency. On the exam, link the base to total fertility rate, CBR, or DTM Stage 2 or early Stage 3 — not to poverty alone.
A narrow base means few children entering the population, often from low fertility below replacement. Over time that can slow growth, create labor shortages, and raise elderly dependency unless immigration adds younger workers.
You compare the area of bars below about age 15 and above about 65 to the working-age middle. A wide base raises youth dependency; a wide top raises elderly dependency. Both shapes press on the tax base and public services.
"Describe" asks you to name the visible age-sex pattern. "Explain" requires a because — a demographic mechanism such as falling infant mortality, pronatalist policy, or male labor out-migration. Description alone rarely earns full credit on explain prompts.
Name one difference in shape for each country, tie each difference to a cause (fertility, mortality, migration), and state one consequence per country or one shared challenge. Use compare language: Country A shows… while Country B shows…
You now know how the AP exam tests pyramids. Page 3 gives you the actual reading method — the one to use on every stimulus question.